Open Access
Fig. 1
Download original image
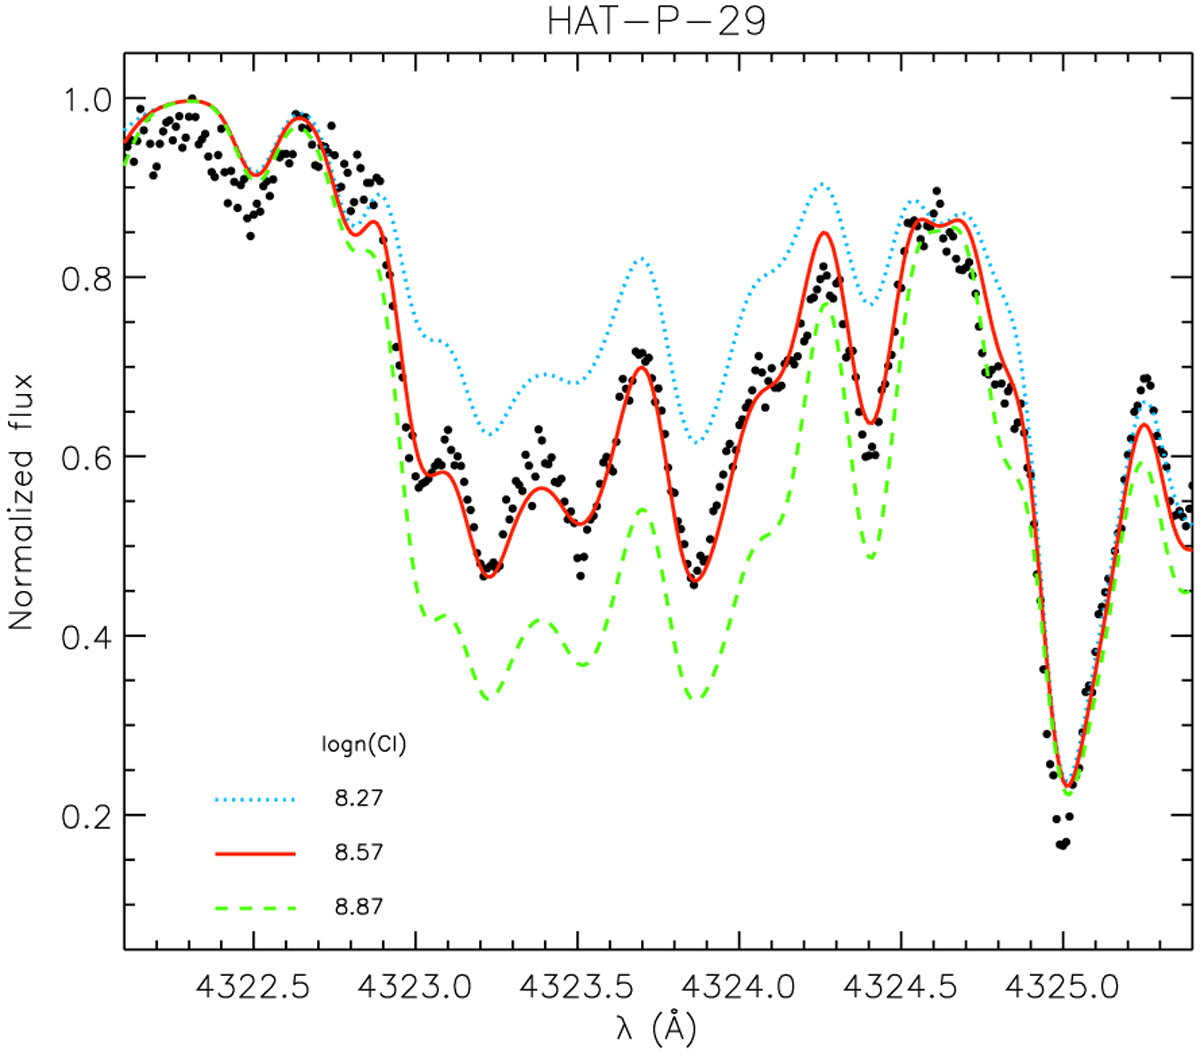
Comparison between observed (black dots) and synthetic spectra for the target HAT-P-29 in the region around the CH band at ~4320 Å. The shown synthetic spectra were computed for log n(C) = 8.57 (red solid line; best fit), 8.87 (green dashed line), 8.27 dex (blue dotted line).
Current usage metrics show cumulative count of Article Views (full-text article views including HTML views, PDF and ePub downloads, according to the available data) and Abstracts Views on Vision4Press platform.
Data correspond to usage on the plateform after 2015. The current usage metrics is available 48-96 hours after online publication and is updated daily on week days.
Initial download of the metrics may take a while.