Fig. 9
Download original image
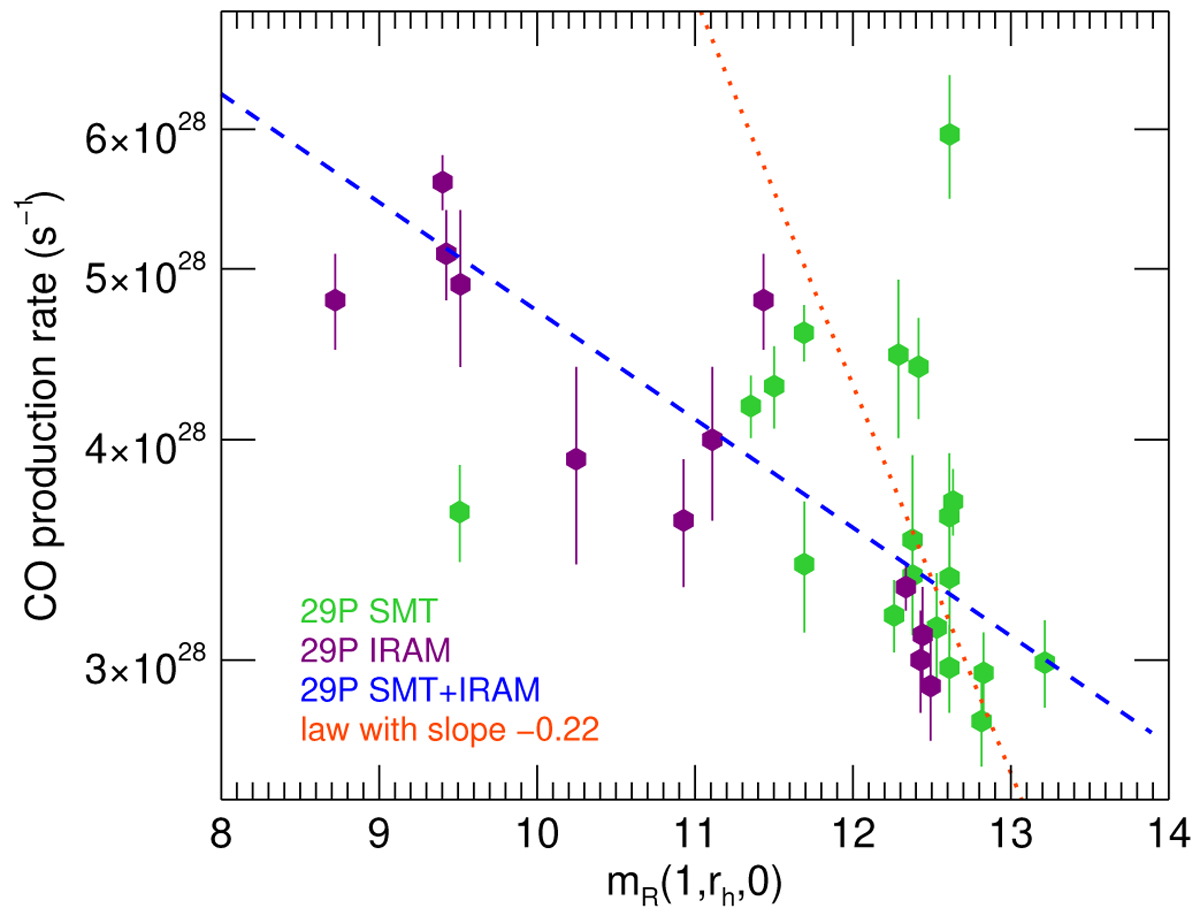
CO production rates as a function of ∆- and phase-corrected red nuclear magnitude mR(1, rh, 0). Purple symbols show CO data from this work. Green symbols show CO data from Wierzchos & Womack (2020). The dashed blue line shows the fit to all data (Eq. (2)). The dotted red line shows the curve log10(Q(CO)) = K −0.22 mR(1, rh, 0), whose regression slope corresponds to that measured for comet Hale-Bopp (K here is an arbitrary constant and not the constant appearing in the Hale-Bopp correlation equation Eq. (B.4)).
Current usage metrics show cumulative count of Article Views (full-text article views including HTML views, PDF and ePub downloads, according to the available data) and Abstracts Views on Vision4Press platform.
Data correspond to usage on the plateform after 2015. The current usage metrics is available 48-96 hours after online publication and is updated daily on week days.
Initial download of the metrics may take a while.