Fig. 8
Download original image
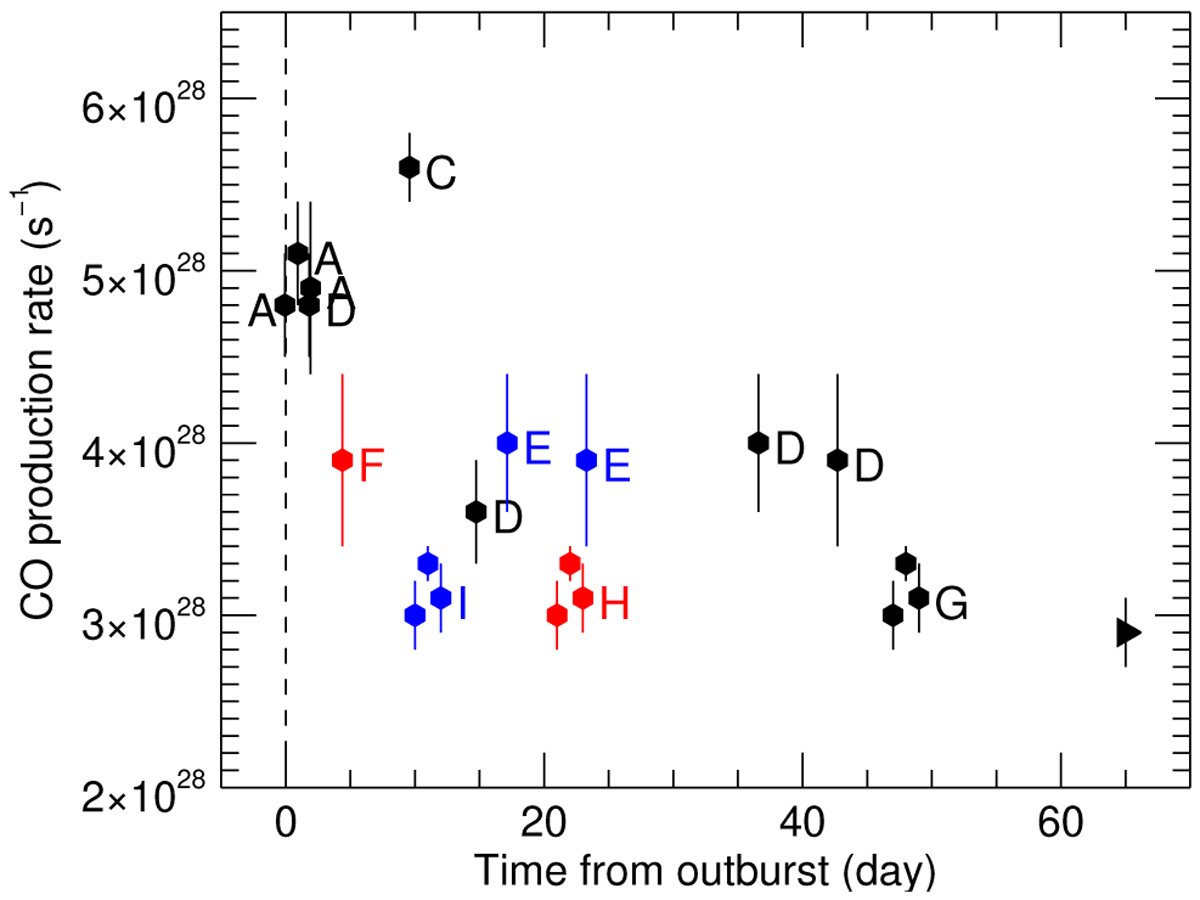
CO production rates as a function of the elapsed time ∆Toutburst between outburst time and observation date. The reference time for ∆Toutburst are outbursts A, C, D, and G (black dots), outbursts F and H (red dots), and outbursts E and I (blue dots). The color code is such that when several outbursts are relevant to a CO measurement, black color is for the brightest, blue colour for the faintest, and red color is for the outburst with intermediate brightness. The black triangle (rightmost data point) refers to the January 2011 measurement obtained more than 93 days after an outburst.
Current usage metrics show cumulative count of Article Views (full-text article views including HTML views, PDF and ePub downloads, according to the available data) and Abstracts Views on Vision4Press platform.
Data correspond to usage on the plateform after 2015. The current usage metrics is available 48-96 hours after online publication and is updated daily on week days.
Initial download of the metrics may take a while.