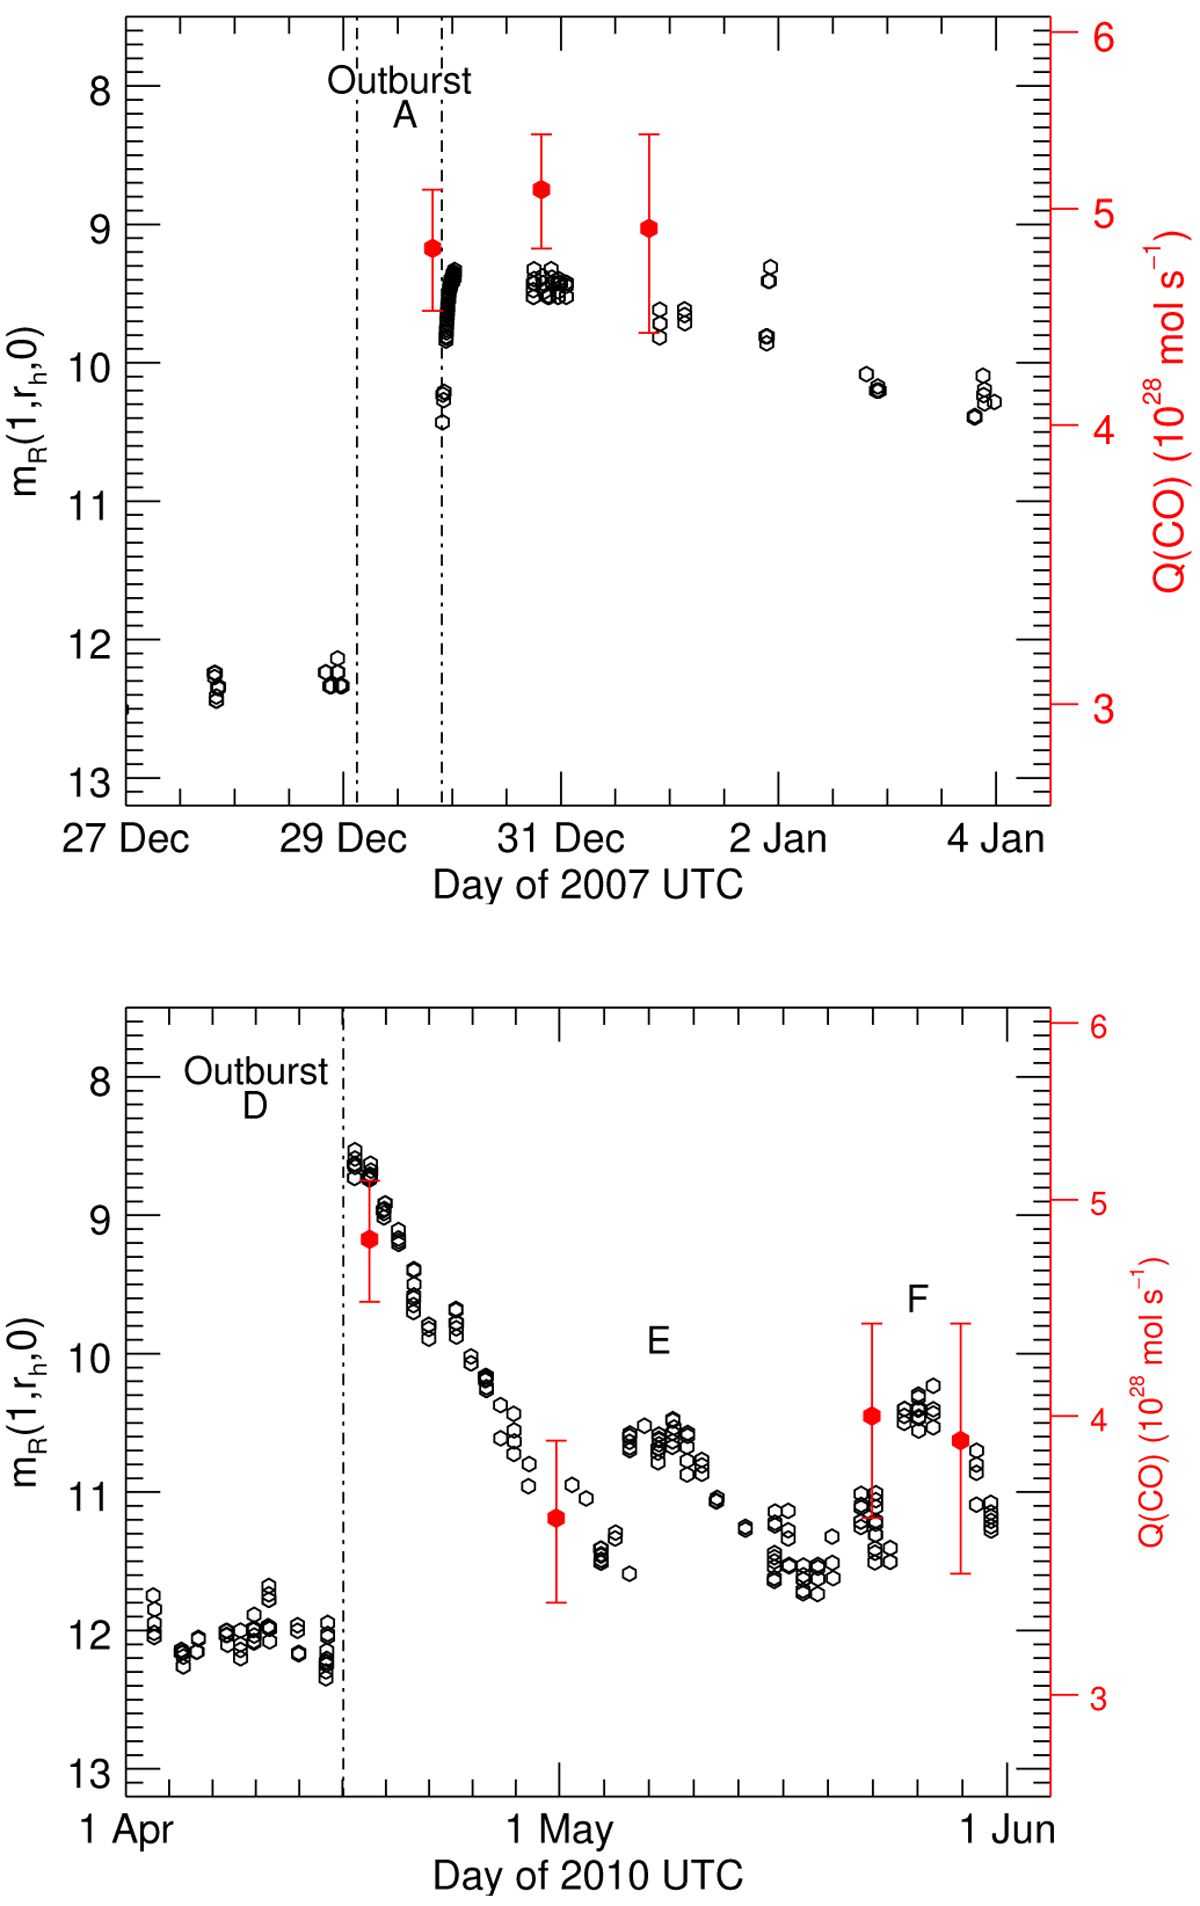
Fig. 7
Download original image
CO production rates and reduced nuclear magnitudes in December 2007 and April-May 2010. The times of outbursts A and D are marked by dot-dashed lines. Outbursts E and F are also shown. The R nuclear magnitudes are measured inside an aperture with a diameter of 10″ (Spanish amateur data reported in Tables D.1 and D.2; homepage of M. Kidger). The relation between the CO and magnitude scales is log10(Q(CO)) = 29.25−0.062 mR(1, rh, 0), consistent with Eq. (2).
Current usage metrics show cumulative count of Article Views (full-text article views including HTML views, PDF and ePub downloads, according to the available data) and Abstracts Views on Vision4Press platform.
Data correspond to usage on the plateform after 2015. The current usage metrics is available 48-96 hours after online publication and is updated daily on week days.
Initial download of the metrics may take a while.