Fig. 5
Download original image
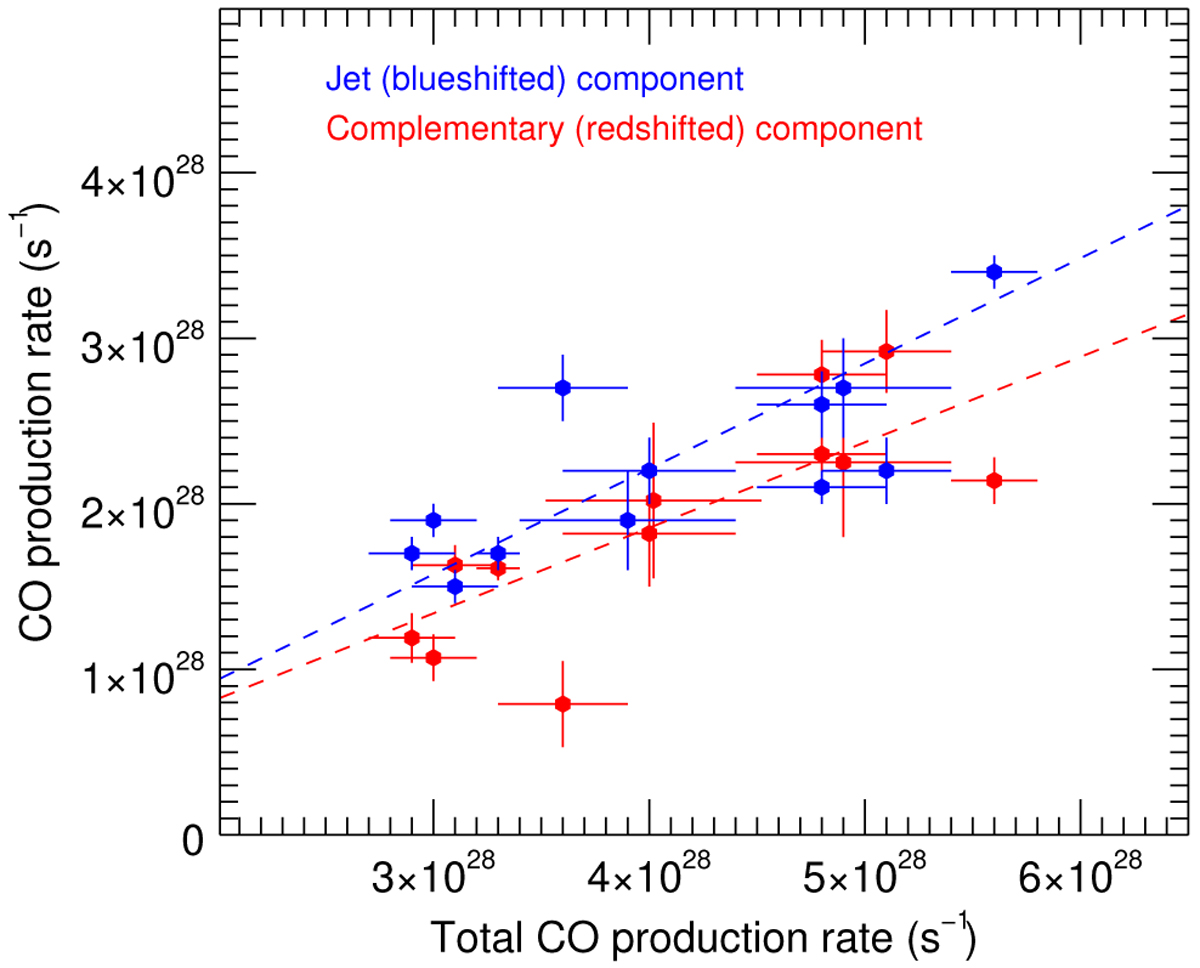
CO production rates in the jet component (blue symbols) and complementary component (red symbols) as a function of the total CO production rate. They are inferred from the line areas measured between −0.7 and −0.3 km s−1, and between −0.3 and +0.4 km s−1, respectively. Values for the jet component and total production rates are given in Table 4. The dashed blue and red lines show linear fits to the data points that correspond to the jet and complementary components, respectively.
Current usage metrics show cumulative count of Article Views (full-text article views including HTML views, PDF and ePub downloads, according to the available data) and Abstracts Views on Vision4Press platform.
Data correspond to usage on the plateform after 2015. The current usage metrics is available 48-96 hours after online publication and is updated daily on week days.
Initial download of the metrics may take a while.