Fig. 4
Download original image
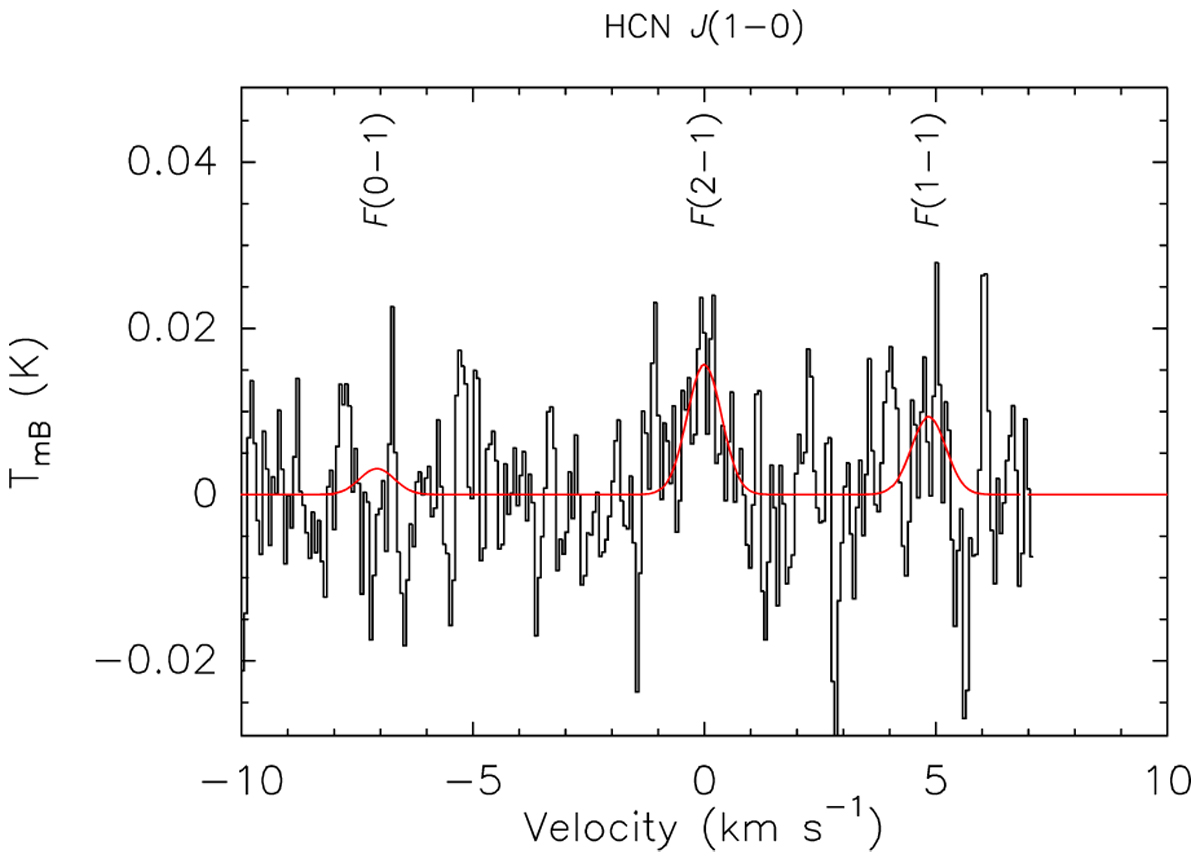
HCN J(1−0) line observed in comet 29P with the IRAM 30 m telescope, averaging 2007 to 2011 data. A Gaussian fit to the F(2−1) main hyperfine component is shown by the red line. The Gaussian curves centered at the velocity of the F(0−1) and F(1−1) were rescaled assuming statistical weight ratios. The vertical scale is the main-beam brightness temperature. The velocity scale is in the comet rest frame. The spectral resolution is 66 m s−1.
Current usage metrics show cumulative count of Article Views (full-text article views including HTML views, PDF and ePub downloads, according to the available data) and Abstracts Views on Vision4Press platform.
Data correspond to usage on the plateform after 2015. The current usage metrics is available 48-96 hours after online publication and is updated daily on week days.
Initial download of the metrics may take a while.