Fig. 2
Download original image
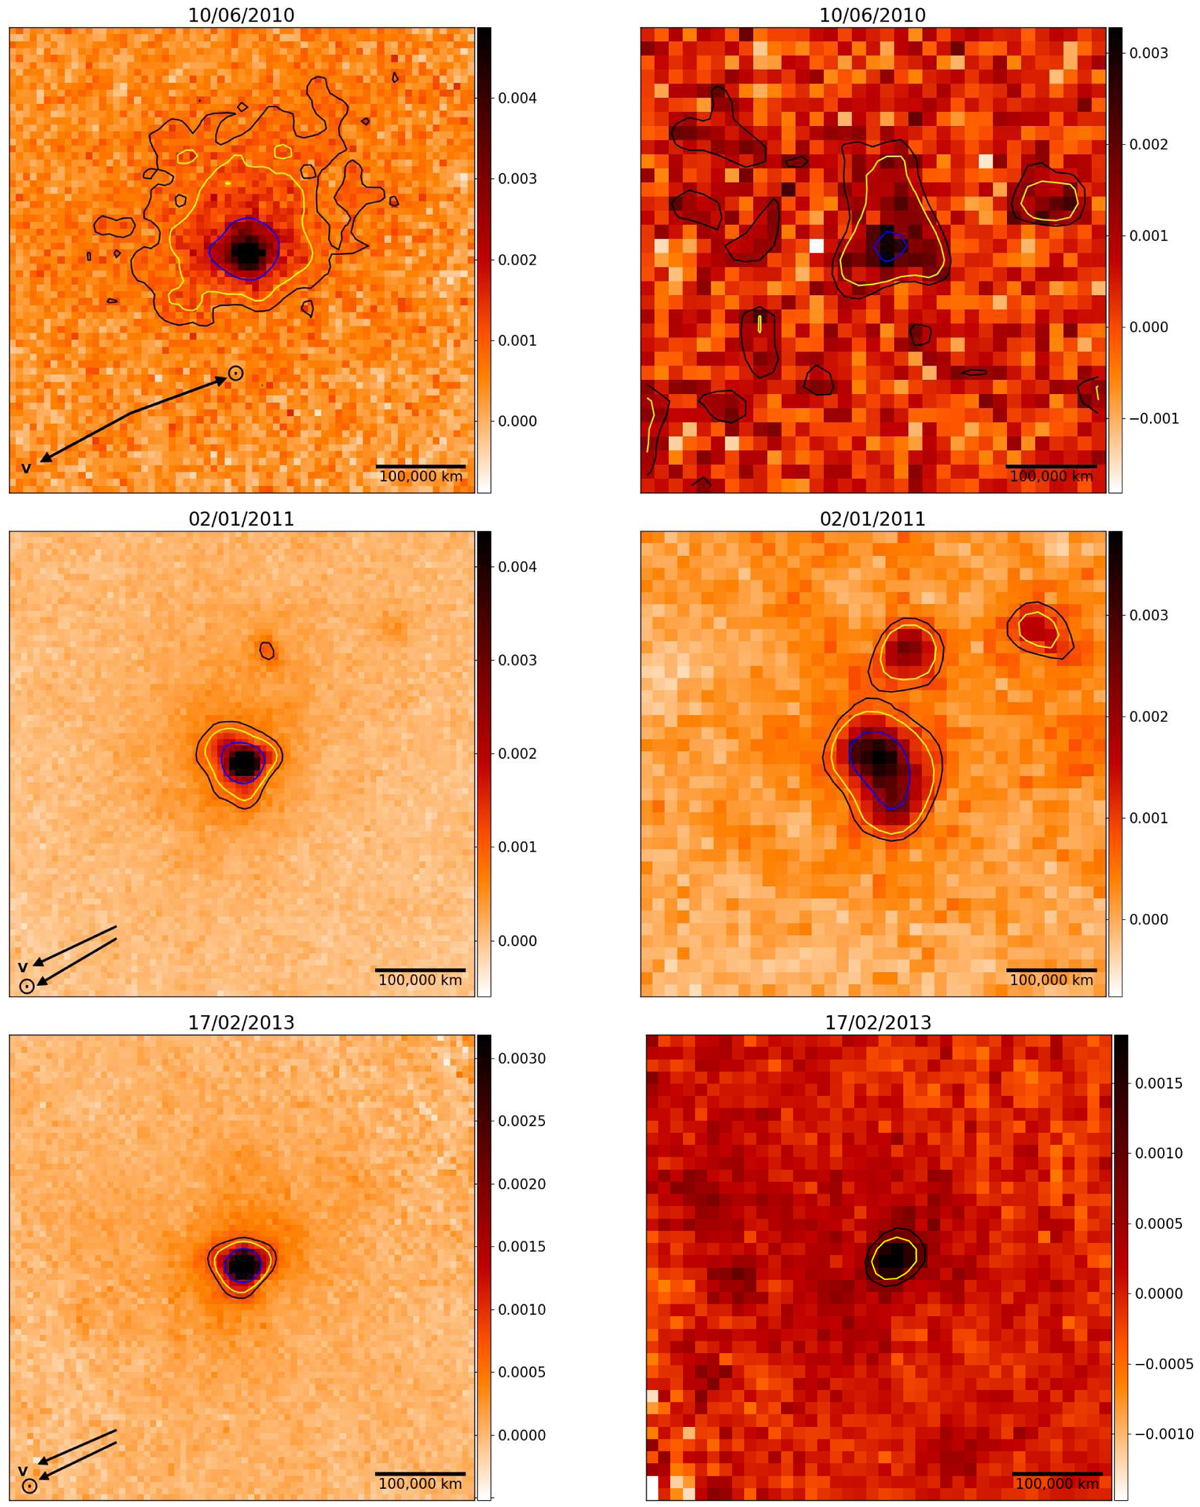
Cropped PACS images of 29P in the 6085 µm band (left) and in the 125–210 µm band (right). Dates from top to bottom are 10 June 2010, 2 January 2011, and 17 February 2013. Flux per pixel (1.6 and 3.2″ for the 70 and 160 µm images, respectively) is given in Jy (color bar). The projected skyplane field of view is the same for each image (5.13 × 105 km × 5.13 × 105 km). Arrows indicate the skyplane-projected Sun direction and comet-projected trajectory. Negative pixel values are the result of the local background subtraction. Comet 29P was in quiescent state at the three dates (Table 1).
Current usage metrics show cumulative count of Article Views (full-text article views including HTML views, PDF and ePub downloads, according to the available data) and Abstracts Views on Vision4Press platform.
Data correspond to usage on the plateform after 2015. The current usage metrics is available 48-96 hours after online publication and is updated daily on week days.
Initial download of the metrics may take a while.