Open Access
Fig. 14
Download original image
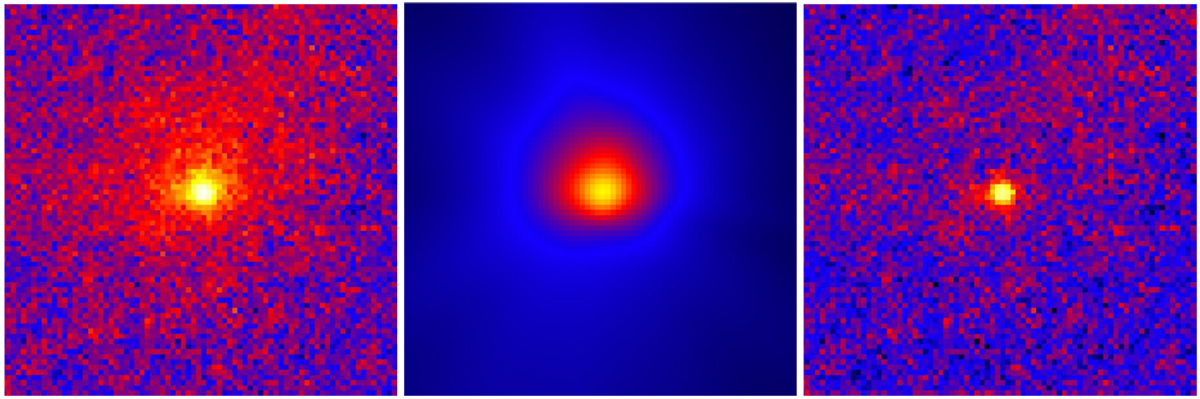
PACS image in the 60−85 μm band from June 10, 2010. From left to right: Observed image (2′ × 2′, 5.77 × 10⁵ km per side; equatorial north is up and east is to the left), the coma model, and the residuals after the coma model was subtracted.
Current usage metrics show cumulative count of Article Views (full-text article views including HTML views, PDF and ePub downloads, according to the available data) and Abstracts Views on Vision4Press platform.
Data correspond to usage on the plateform after 2015. The current usage metrics is available 48-96 hours after online publication and is updated daily on week days.
Initial download of the metrics may take a while.