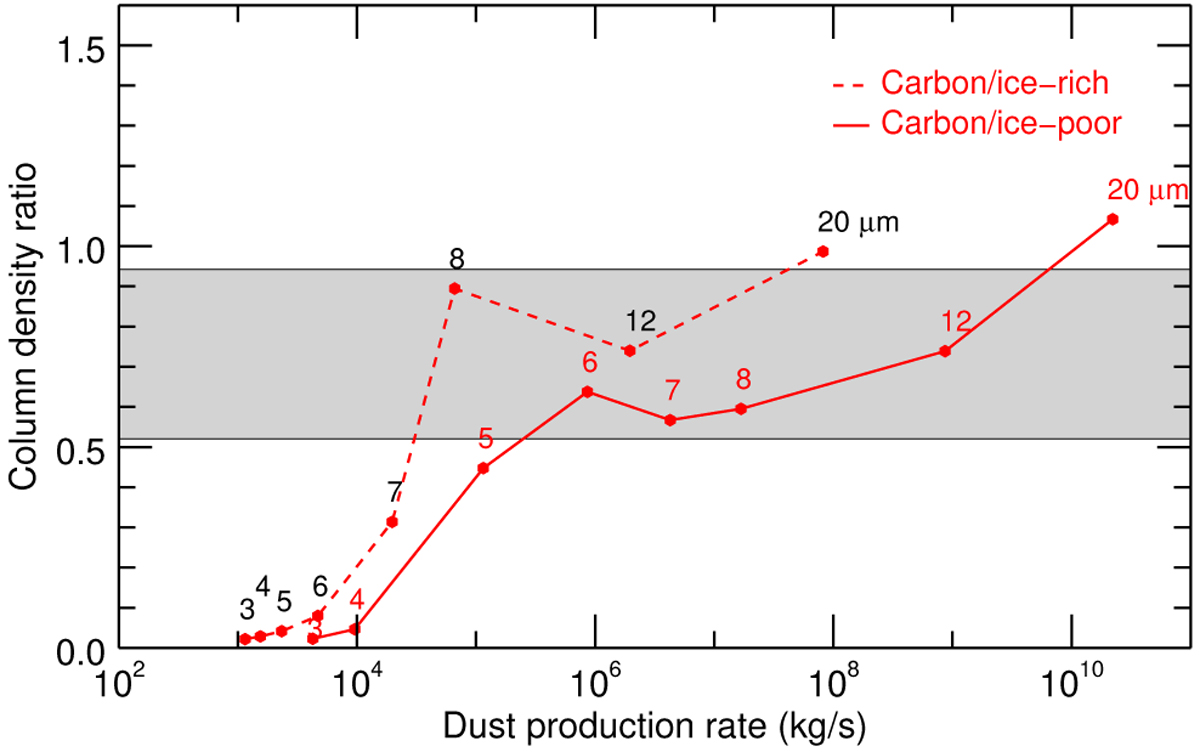
Fig. 13
Download original image
Model outputs for the ratio of the H2O column densities within the HIFI beam at ∆Toutburst = 25 days and ∆Toutburst = 3 days (referred as to ζ in the text). For comparison, the measured intensity ratio of 0.73 ± 0.21 between 11 May 2010 and 19 April 2010 is indicated by the gray region. For all models, the number of molecules within the HIFI beam is 1033 molecules at time ∆Toutburst = 3 days, corresponding to the 19.05 April 2010 observation, and the derived dust production is given in the x-axis. The model parameters are the outburst duration of 2 days, amax = 50 μm, and α = −3.5. amin takes different values from 3 to 20 μm, which are indicated (in μm units) on the plot above the corresponding model results. Results are shown for both ice-poor (vi = 0.5) and ice-rich (vi = 0.1) carbon grains.
Current usage metrics show cumulative count of Article Views (full-text article views including HTML views, PDF and ePub downloads, according to the available data) and Abstracts Views on Vision4Press platform.
Data correspond to usage on the plateform after 2015. The current usage metrics is available 48-96 hours after online publication and is updated daily on week days.
Initial download of the metrics may take a while.