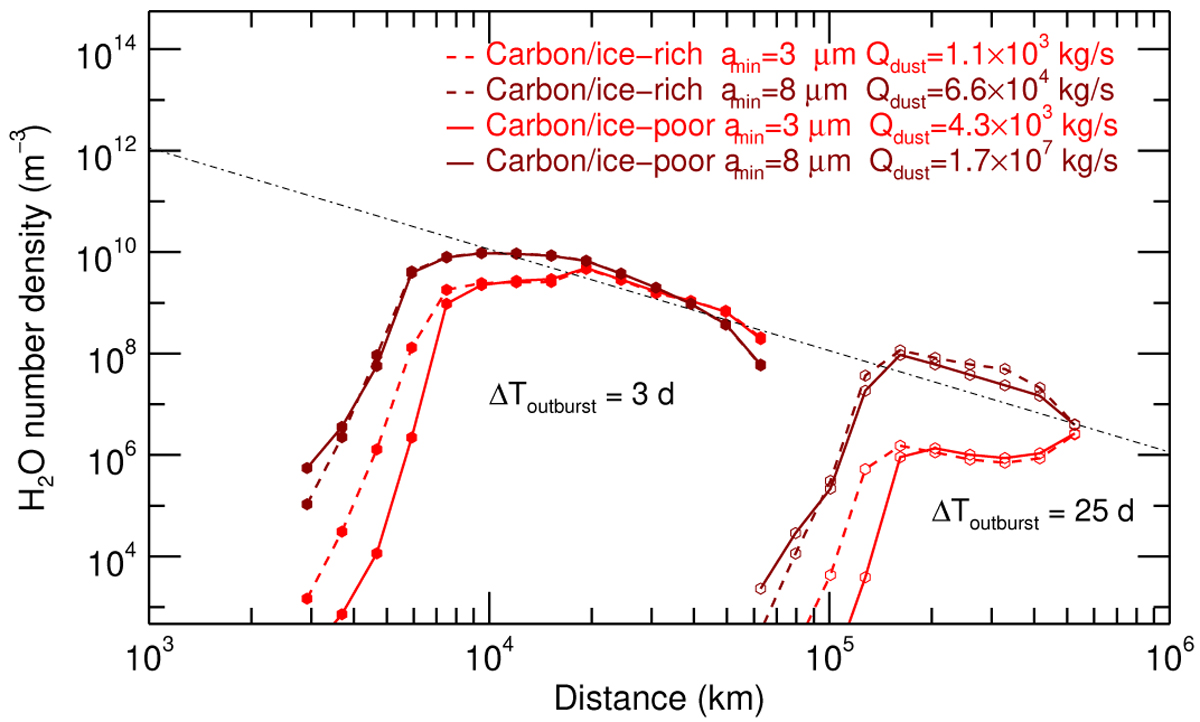
Fig. 12
Download original image
Radial H2O number density in the coma of 29P after an outburst releasing icy grains during two days at a rate Qdust. The results are shown for an elapsed time ∆Toutburst = 3 days from the onset of the outburst (plain symbols, leftmost curves) and ∆Toutburst = 25 days (open symbols, rightmost curves). Qdust (given in the legend) is set so that the number of molecules within the HIFI beam (whose projected radius is ~8 × 10⁴ km) is 1033 molecules at time ∆Toutburst = 3 days, corresponding to the 19.05 April 2010 measurement. The results for amin = 3 and 8 μm are shown in red and dark red, respectively. The maximum grain radius is amax = 50 μm, and the size index is α = −3.5. Results are shown for both ice-poor (vi = 0.5) and ice-rich (vi = 0.1) carbon grains. The dot-dashed line is a Haser model with Q(H2O) = 4.6 × 1027 s−1 and expansion velocity ![]() .
.
Current usage metrics show cumulative count of Article Views (full-text article views including HTML views, PDF and ePub downloads, according to the available data) and Abstracts Views on Vision4Press platform.
Data correspond to usage on the plateform after 2015. The current usage metrics is available 48-96 hours after online publication and is updated daily on week days.
Initial download of the metrics may take a while.