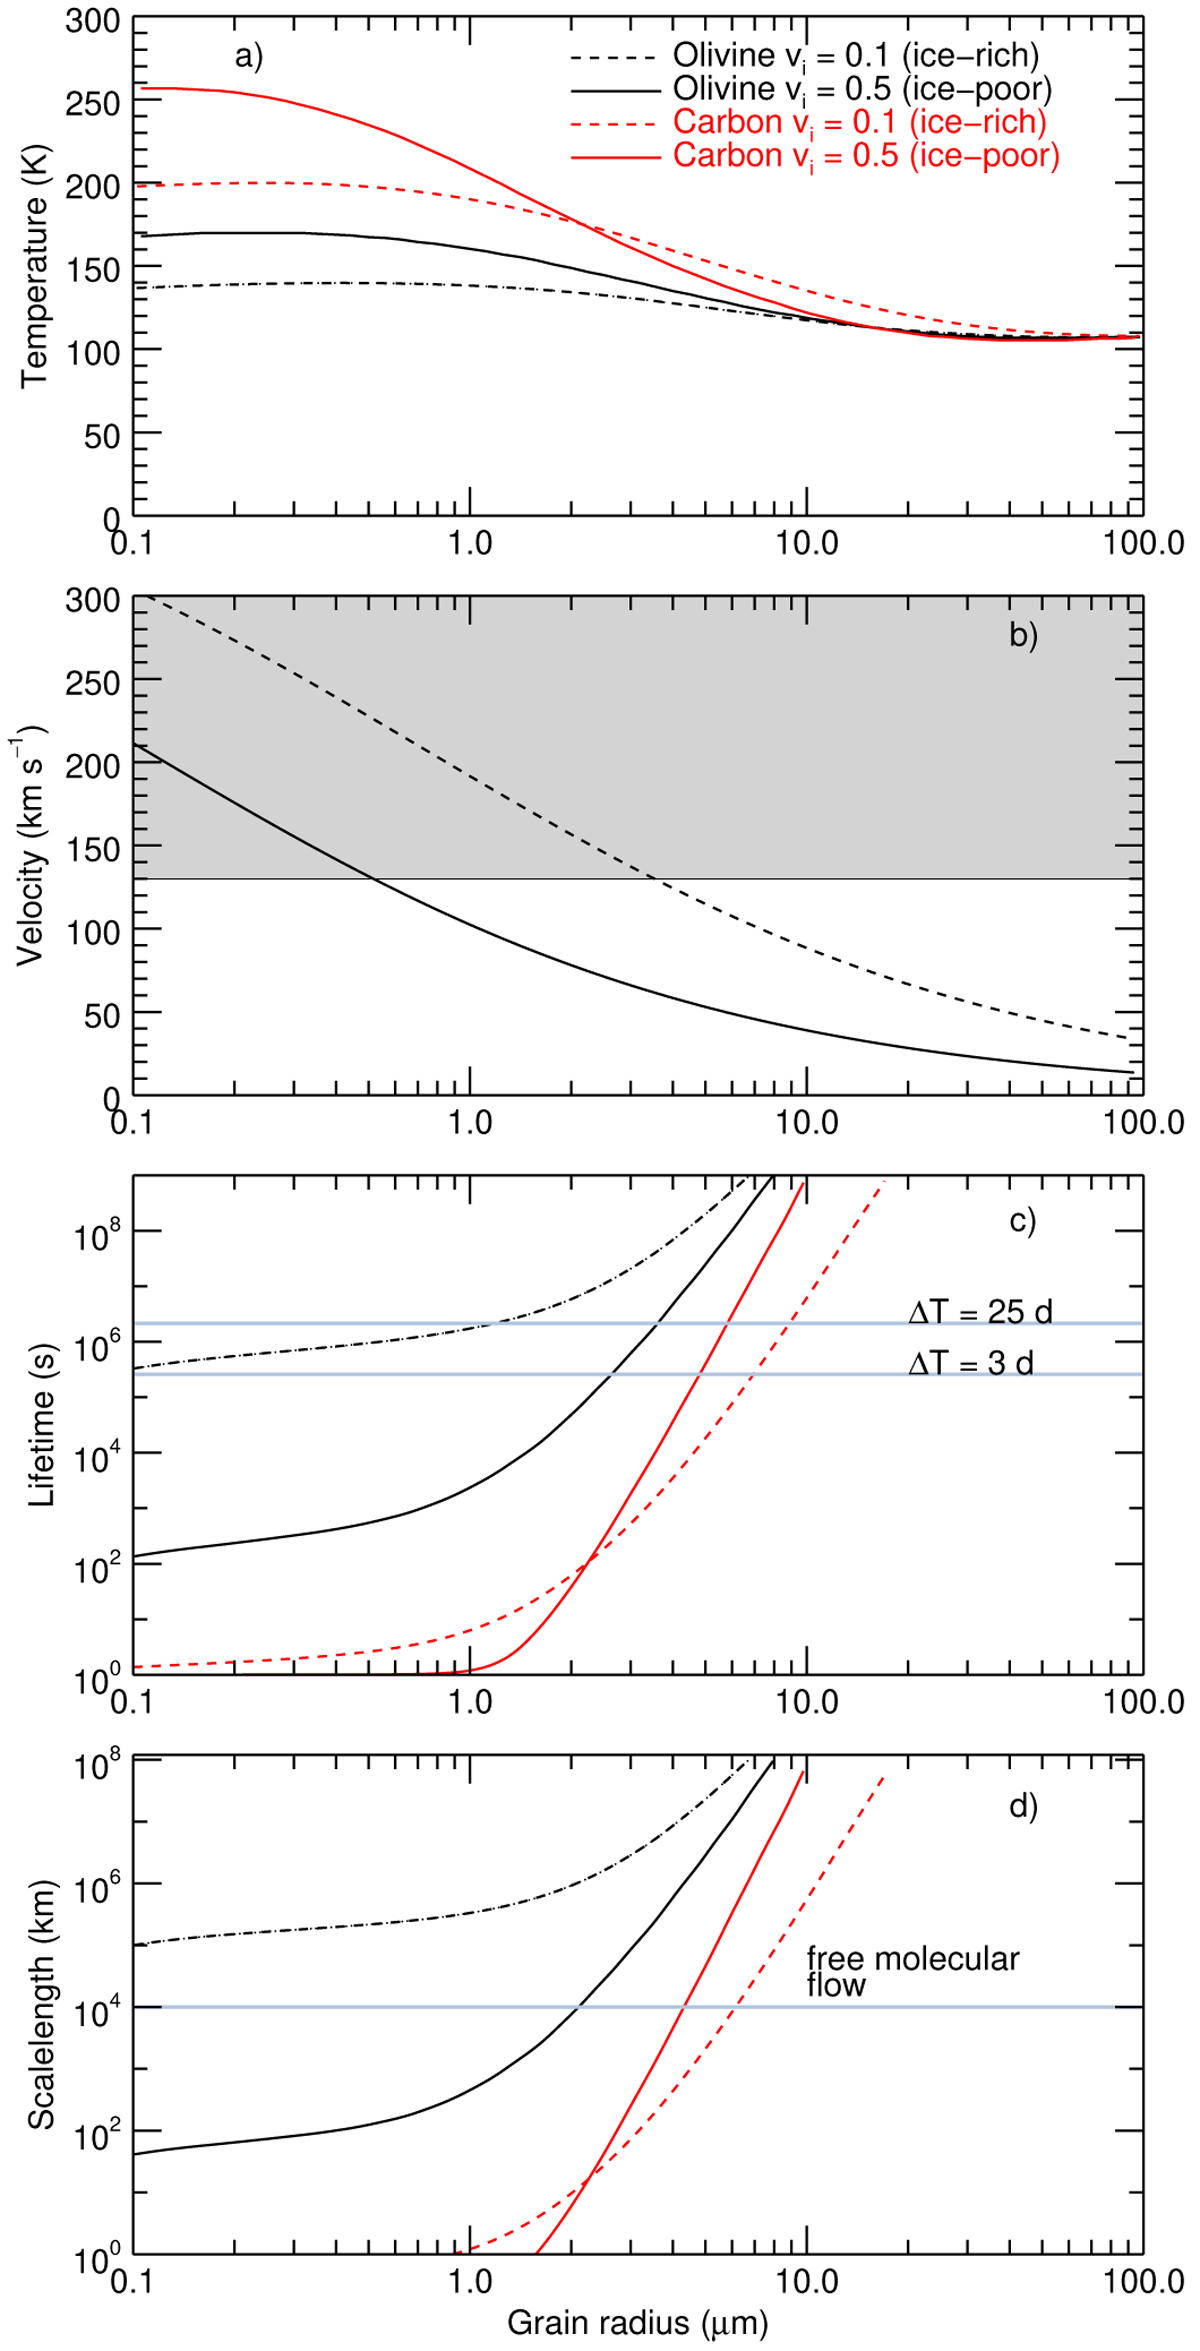
Fig. 11
Download original image
Properties of icy grains as a function of size. (a) Grain temperature. (b) Grain velocity computed assuming a CO production rate of 4 × 1028 s−1 emitted in a cone with a half-angle equal to ψ = 45° (dashed curve) or ψ = 180° (solid curve), and a dust and nucleus density equal to 500 kg m−3. Velocities in the gray region are excluded at 1σ from the velocity offset of the H2O and HCN lines. (c) Grain-sublimation lifetime; the two horizontal blue dotted lines correspond to the elapsed time between the 16.05 April 2010 outburst and the Berschel H2O observations. (d) Scale length defined as the product of the grain-sublimation lifetime times the grain velocity (calculated with ψ = 45°); the horizontal line corresponds to the limit of CO free-molecular flow (see text). In panels a, c and d the black and red curves correspond to crystalline ice mixed with olivine and carbon, respectively. Solid and dashed lines show ice-poor grains (vi = 0.5, ice mass fraction of 29%) and ice-rich grains (vi = 0.1, ice mass fraction of 78%), respectively.
Current usage metrics show cumulative count of Article Views (full-text article views including HTML views, PDF and ePub downloads, according to the available data) and Abstracts Views on Vision4Press platform.
Data correspond to usage on the plateform after 2015. The current usage metrics is available 48-96 hours after online publication and is updated daily on week days.
Initial download of the metrics may take a while.