Open Access
Fig. 10
Download original image
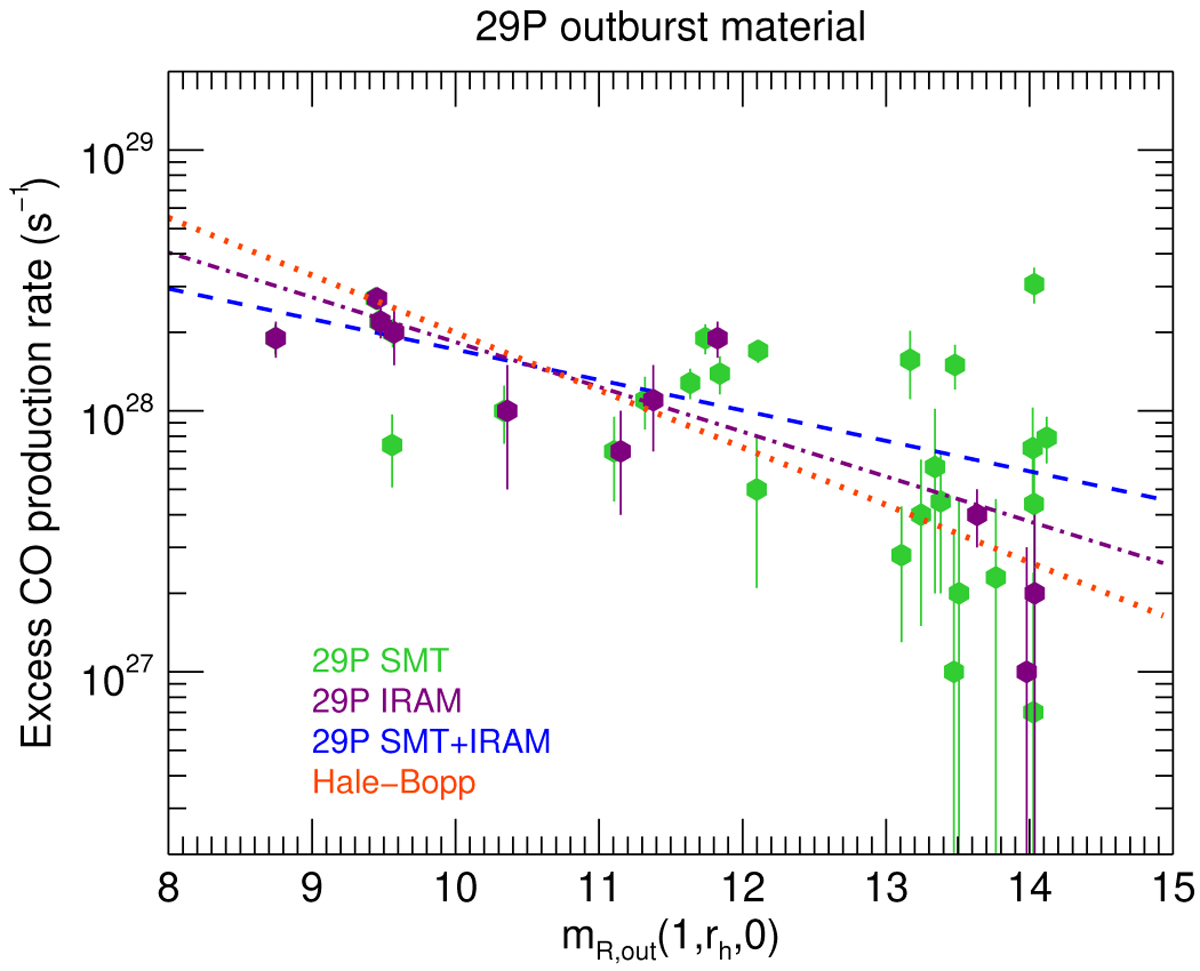
Same as Fig. 9, but considering the contribution of outburst material. The dashed blue line shows the fit to all 29P data (Eq. (5)). The dot-dashed purple line shows the fit to IRAM 29P data (Eq. (6)). The dotted red line shows the curve log10(Q(CO)) = 30.5 −0.22 mR(1, rh, 0) determined for comet Hale-Bopp (Appendix B).
Current usage metrics show cumulative count of Article Views (full-text article views including HTML views, PDF and ePub downloads, according to the available data) and Abstracts Views on Vision4Press platform.
Data correspond to usage on the plateform after 2015. The current usage metrics is available 48-96 hours after online publication and is updated daily on week days.
Initial download of the metrics may take a while.