Fig. 1.
Download original image
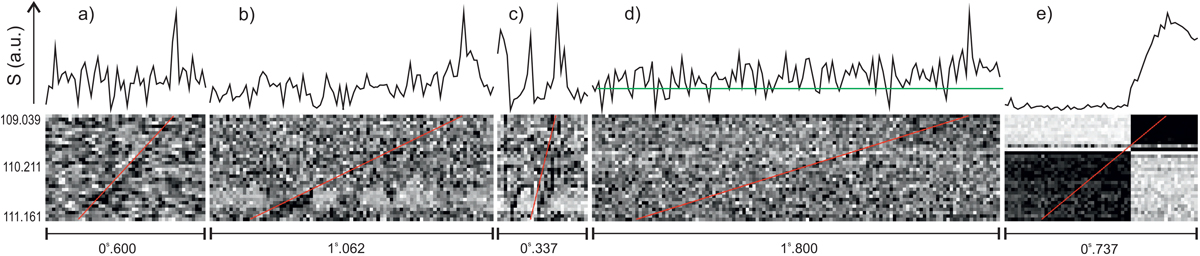
Examples of interferences that are missed by the neural network. The lower part of the figure is the dynamic spectra, the red line is drawn along the candidate RRAT, and the degree of the line slope reflects the DM. Above the dynamic spectrum, a profile is shown. It was assembled taking into account the expected DM. The recording duration in seconds is shown below each dynamic spectrum. The frequencies of some channels are shown vertically near the dynamic spectrum, and near the profile, there is a flux density in arbitrary units. Figure 1d shows the baseline from which the signal amplitude was calculated in green.
Current usage metrics show cumulative count of Article Views (full-text article views including HTML views, PDF and ePub downloads, according to the available data) and Abstracts Views on Vision4Press platform.
Data correspond to usage on the plateform after 2015. The current usage metrics is available 48-96 hours after online publication and is updated daily on week days.
Initial download of the metrics may take a while.