Fig. A.1.
Download original image
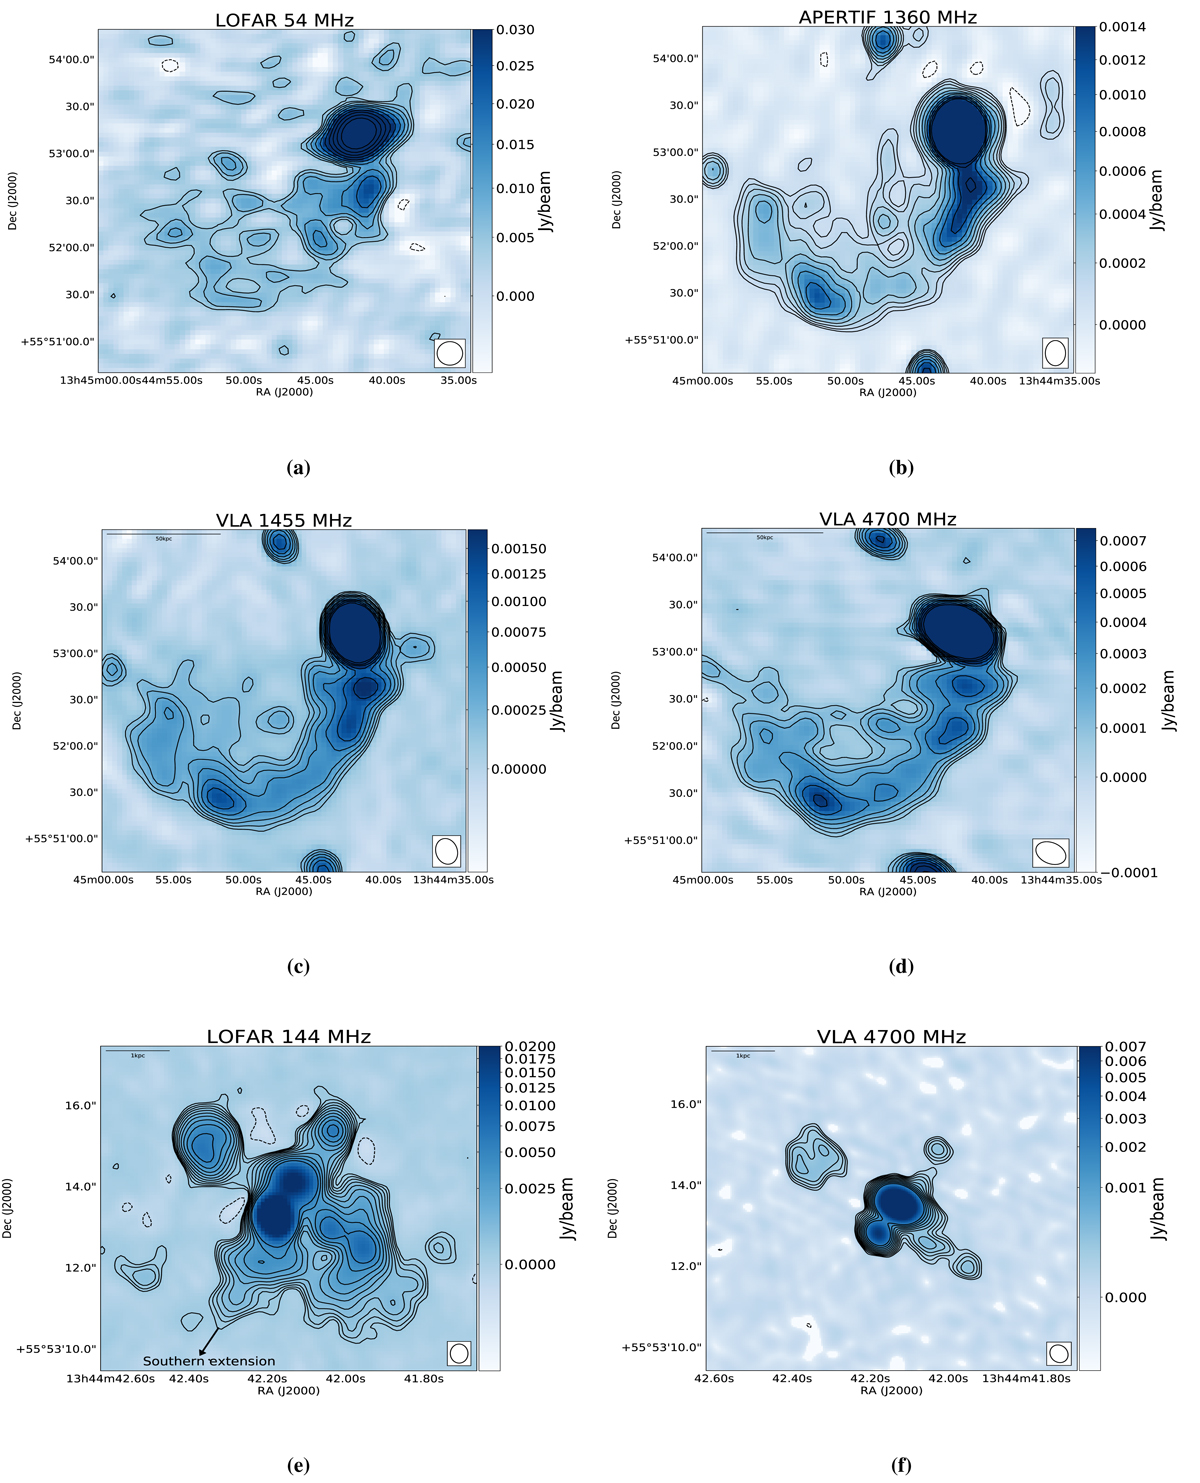
Continuum images of Mrk 273. Images in the first and second row show the large-scale structure at (a) 54 MHz with LOFAR LBA, (b) 1360 MHz with Apertif, (c) 1455 MHz with VLA and (d) 4700 MHz with VLA. The third and fourth row show small-scale structure in the nuclear region with (e) LOFAR at 144 MHz, VLA at (f) 4700 MHz and (g) 8415 MHz. The contour levels in all images are 3![]() where n = 0,1,2...10. σrms is 1.5 mJy beam−1, 35 μJy beam−1, 60 μJy beam−1 and 30 μJy beam−1 for the LOFAR 54 MHz (a), Apertif 1360 MHz (b), VLA 1455 MHz (c) and VLA 4700 MHz (d) image, respectively. For the high resolution images, σrms is 78 μJy beam−1, 30 μJy beam−1 and 28 μJy beam−1 for the (e) LOFAR 144 MHz, (f) VLA 4700 MHz and (g) VLA 8415 MHz image, respectively. The LOFAR 144 MHz sub-arcsecond image has a lower resolution of 0.4″×0.5″, than the one in Fig. 2. The negative contours are marked by dashed lines and are at −3σrms level. Image statistics are summarised in Table 1.
where n = 0,1,2...10. σrms is 1.5 mJy beam−1, 35 μJy beam−1, 60 μJy beam−1 and 30 μJy beam−1 for the LOFAR 54 MHz (a), Apertif 1360 MHz (b), VLA 1455 MHz (c) and VLA 4700 MHz (d) image, respectively. For the high resolution images, σrms is 78 μJy beam−1, 30 μJy beam−1 and 28 μJy beam−1 for the (e) LOFAR 144 MHz, (f) VLA 4700 MHz and (g) VLA 8415 MHz image, respectively. The LOFAR 144 MHz sub-arcsecond image has a lower resolution of 0.4″×0.5″, than the one in Fig. 2. The negative contours are marked by dashed lines and are at −3σrms level. Image statistics are summarised in Table 1.
Current usage metrics show cumulative count of Article Views (full-text article views including HTML views, PDF and ePub downloads, according to the available data) and Abstracts Views on Vision4Press platform.
Data correspond to usage on the plateform after 2015. The current usage metrics is available 48-96 hours after online publication and is updated daily on week days.
Initial download of the metrics may take a while.