Fig. 7.
Download original image
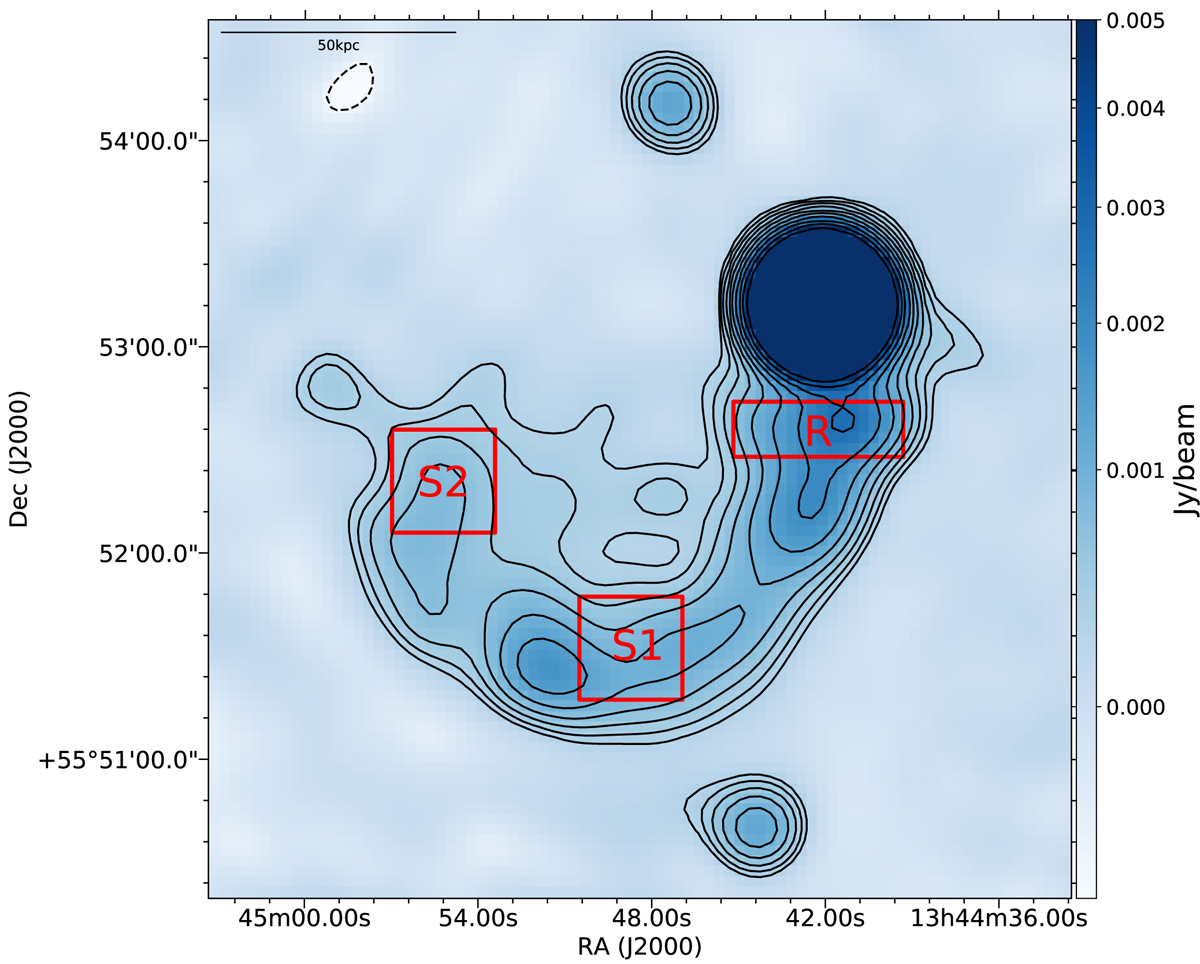
VLA 1455 MHz image of Mrk 273 at a resolution of 20″ × 20″. The solid lines mark the positive contour levels at: 3![]() where n = 0,1,2...10 and σrms = 80 μJy beam−1. The negative contours are marked by dashed lines and are at −3σrms level. The regions used to extract flux densities in Sect. 3.4 are marked and summarised in Table 3.
where n = 0,1,2...10 and σrms = 80 μJy beam−1. The negative contours are marked by dashed lines and are at −3σrms level. The regions used to extract flux densities in Sect. 3.4 are marked and summarised in Table 3.
Current usage metrics show cumulative count of Article Views (full-text article views including HTML views, PDF and ePub downloads, according to the available data) and Abstracts Views on Vision4Press platform.
Data correspond to usage on the plateform after 2015. The current usage metrics is available 48-96 hours after online publication and is updated daily on week days.
Initial download of the metrics may take a while.