Open Access
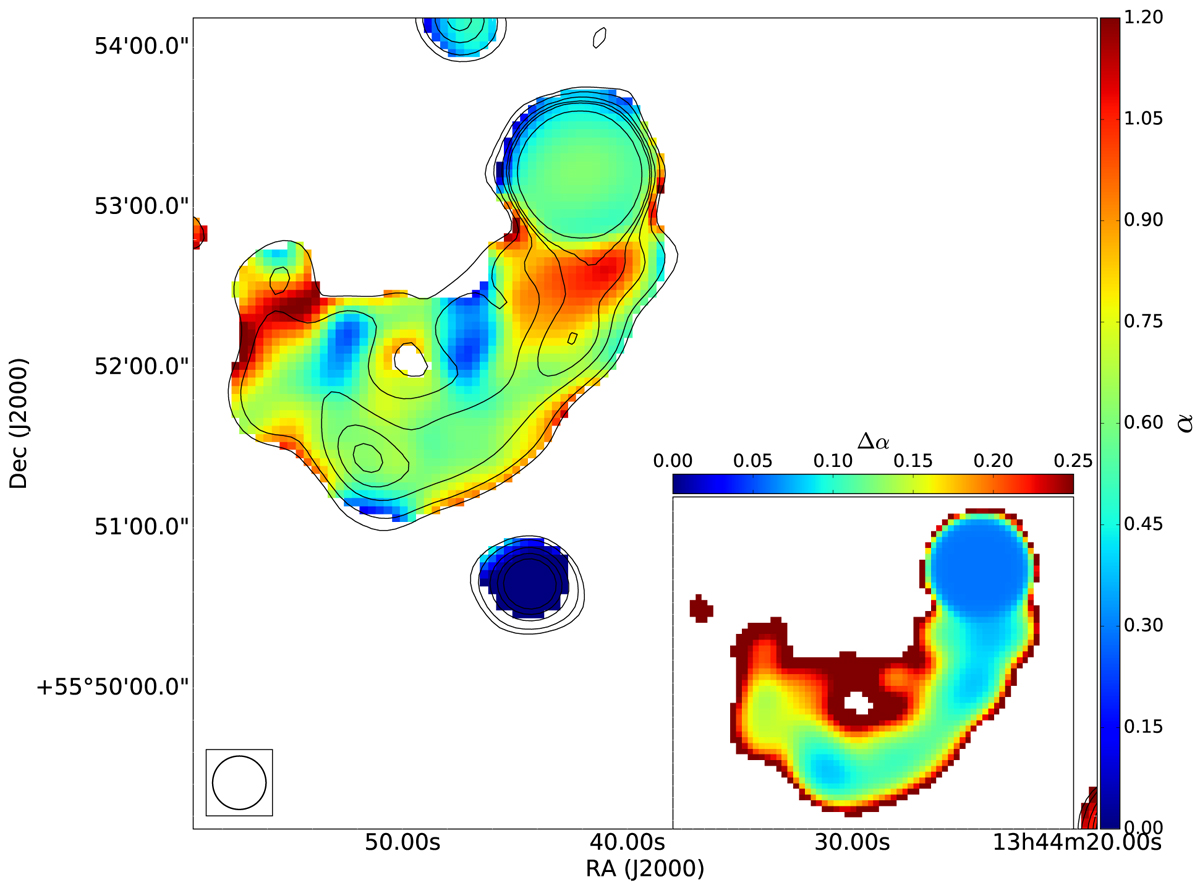
Fig. 6.
Download original image
20″ spectral index map from 1455−4700 MHz made with the VLA images. The local rms noise, σrms, in the 1455 MHz image is 80 μJy beam−1 and in the 4700 MHz image is 40 μJy beam−1. The contours mark the 4700 MHz emission at levels (3, 5, 10, 15, 20, 50)×σrms. The inset map shows the spectral index error.
Current usage metrics show cumulative count of Article Views (full-text article views including HTML views, PDF and ePub downloads, according to the available data) and Abstracts Views on Vision4Press platform.
Data correspond to usage on the plateform after 2015. The current usage metrics is available 48-96 hours after online publication and is updated daily on week days.
Initial download of the metrics may take a while.