Fig. 4.
Download original image
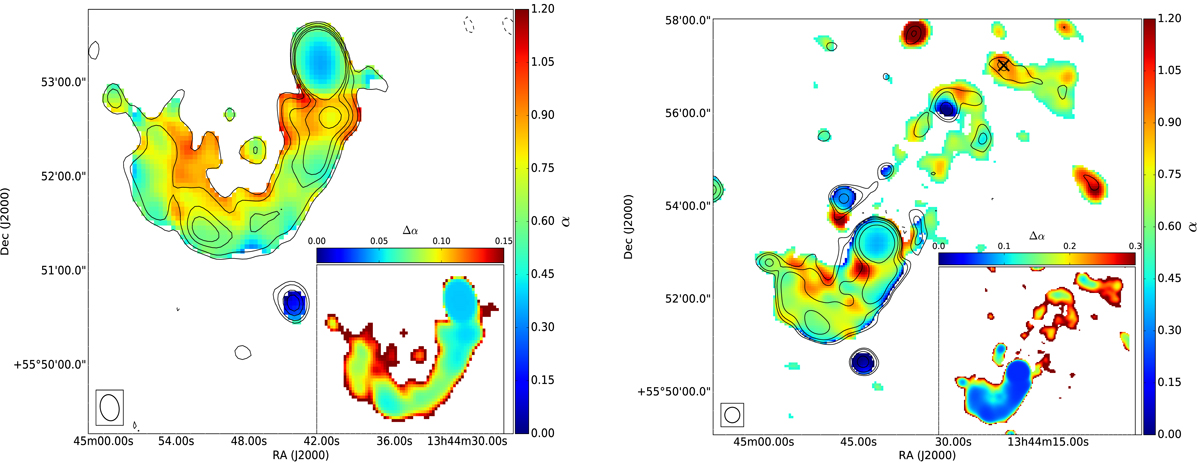
Spectral index maps of large scale emission in Mrk 273. (a) Spectral index map from 144−1455 MHz made with the LOFAR and VLA images at 16.8″ × 13″ resolution. The local rms noise, σrms, in the 144 MHz image is 200 μJy beam−1 and in the 1455 MHz image is 60 μJy beam−1. The contours mark the 1455 MHz emission at levels (−3, 3, 5, 10, 15, 25)×σrms. The map shows a spectral gradient across the arc, with α ∼ 0.6 at the southern outer edge and ∼0.9 at the northern inner edge. The ridge has a steep spectral index of α ≈ 0.88 ± 0.07. (b) The 20″ spectral index map from 144−1360 MHz made with the LOFAR and Apertif images. The local rms noise, σrms, in the 144 MHz image is 100 μJy beam−1 and in the 1360 MHz image is 37 μJy beam−1. The contours mark the 1360 MHz emission at levels (−3, 3, 5, 10, 25, 100)×σrms′. The pixels outside the 3σ contours show the lower limit of the spectral index. The black cross marks the background galaxy present at the location of the northern arc. The inset maps show the spectral index errors. (a) Spectral index map ![]() at 16.8″ × 13″ resolution. (b) Spectral index map
at 16.8″ × 13″ resolution. (b) Spectral index map ![]() at 20″ × 20″ resolution.
at 20″ × 20″ resolution.
Current usage metrics show cumulative count of Article Views (full-text article views including HTML views, PDF and ePub downloads, according to the available data) and Abstracts Views on Vision4Press platform.
Data correspond to usage on the plateform after 2015. The current usage metrics is available 48-96 hours after online publication and is updated daily on week days.
Initial download of the metrics may take a while.