Fig. 4.
Download original image
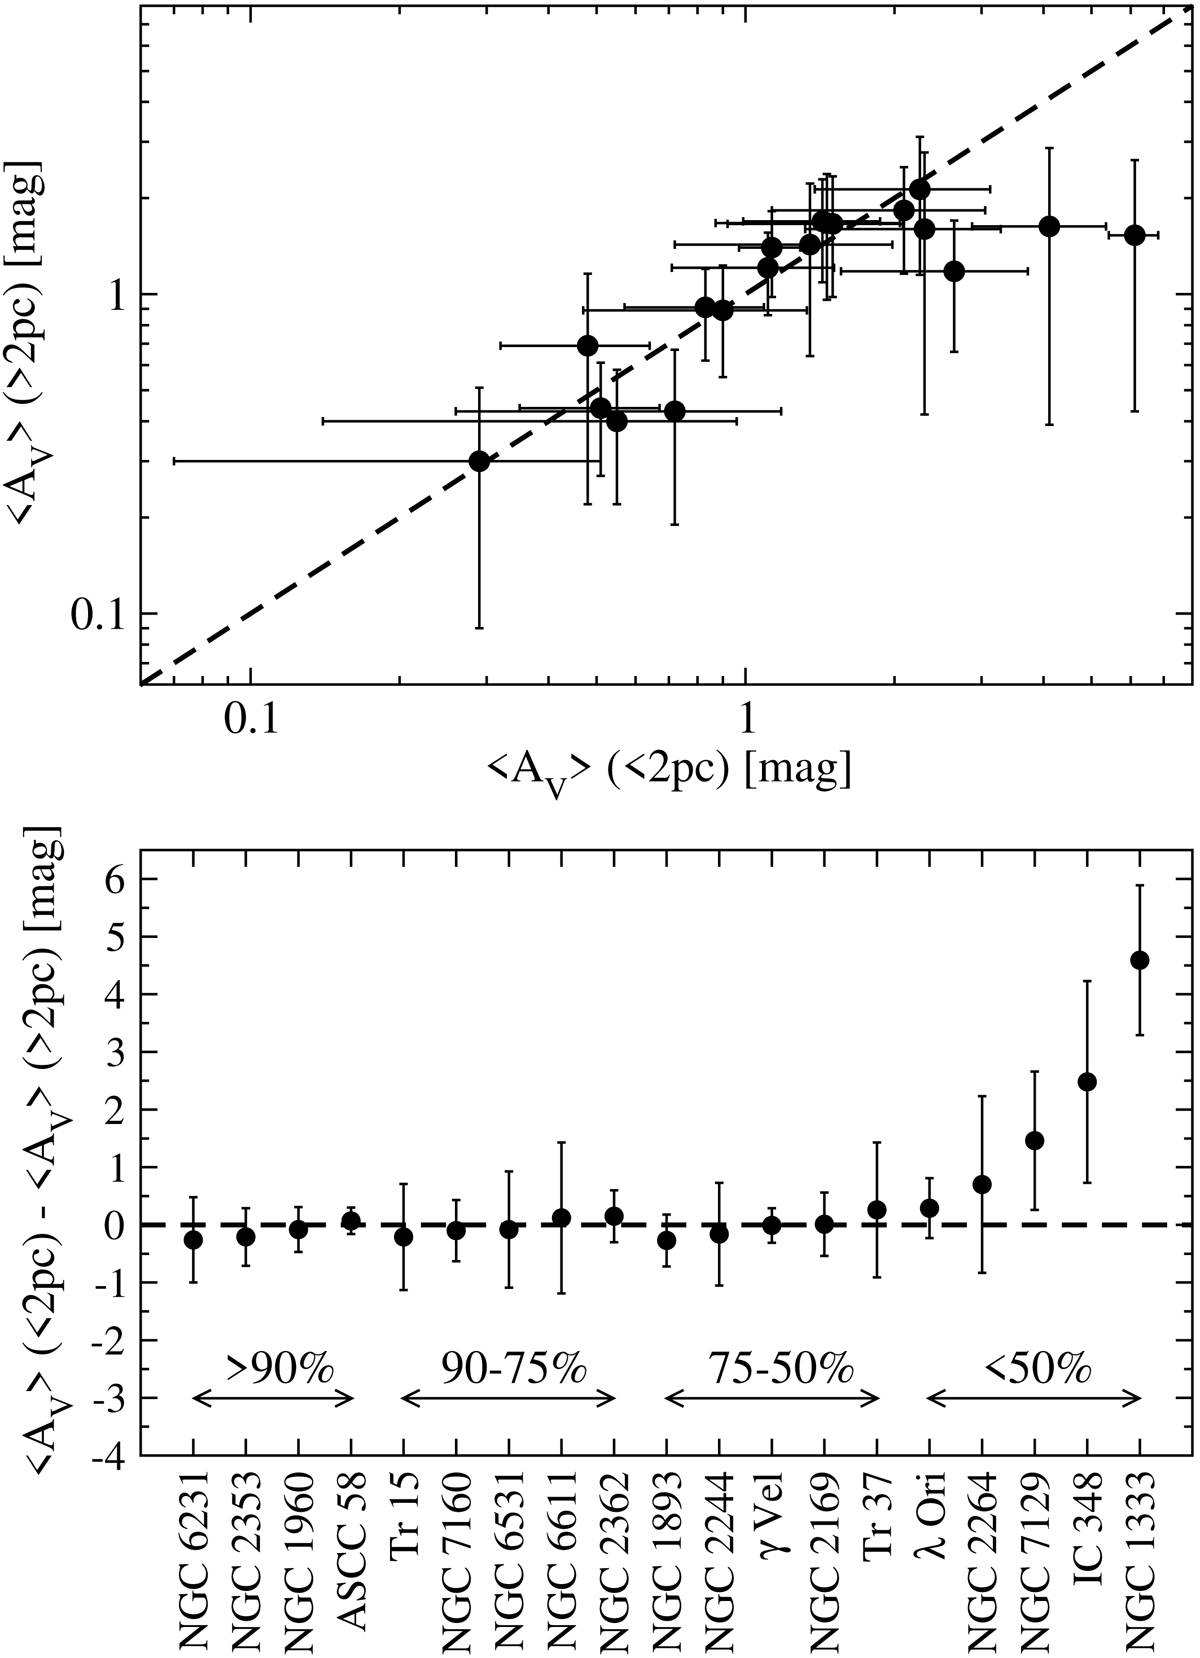
Mean optical extinction from the stars located closer and farther than 2 pc from the center of each cluster plotted against each other in the top panel (log-scale), and their differences in the bottom panel. The dashed lines indicate equal values in both panels. Standard deviations within each cluster are adopted as error bars in the top panel. Uncertainties in the bottom panel are derived from the propagation of the individual 1σ deviations. The fraction of member stars for which extinction values from Anders et al. (2022) are available for each cluster is indicated above the arrows in the bottom panel.
Current usage metrics show cumulative count of Article Views (full-text article views including HTML views, PDF and ePub downloads, according to the available data) and Abstracts Views on Vision4Press platform.
Data correspond to usage on the plateform after 2015. The current usage metrics is available 48-96 hours after online publication and is updated daily on week days.
Initial download of the metrics may take a while.