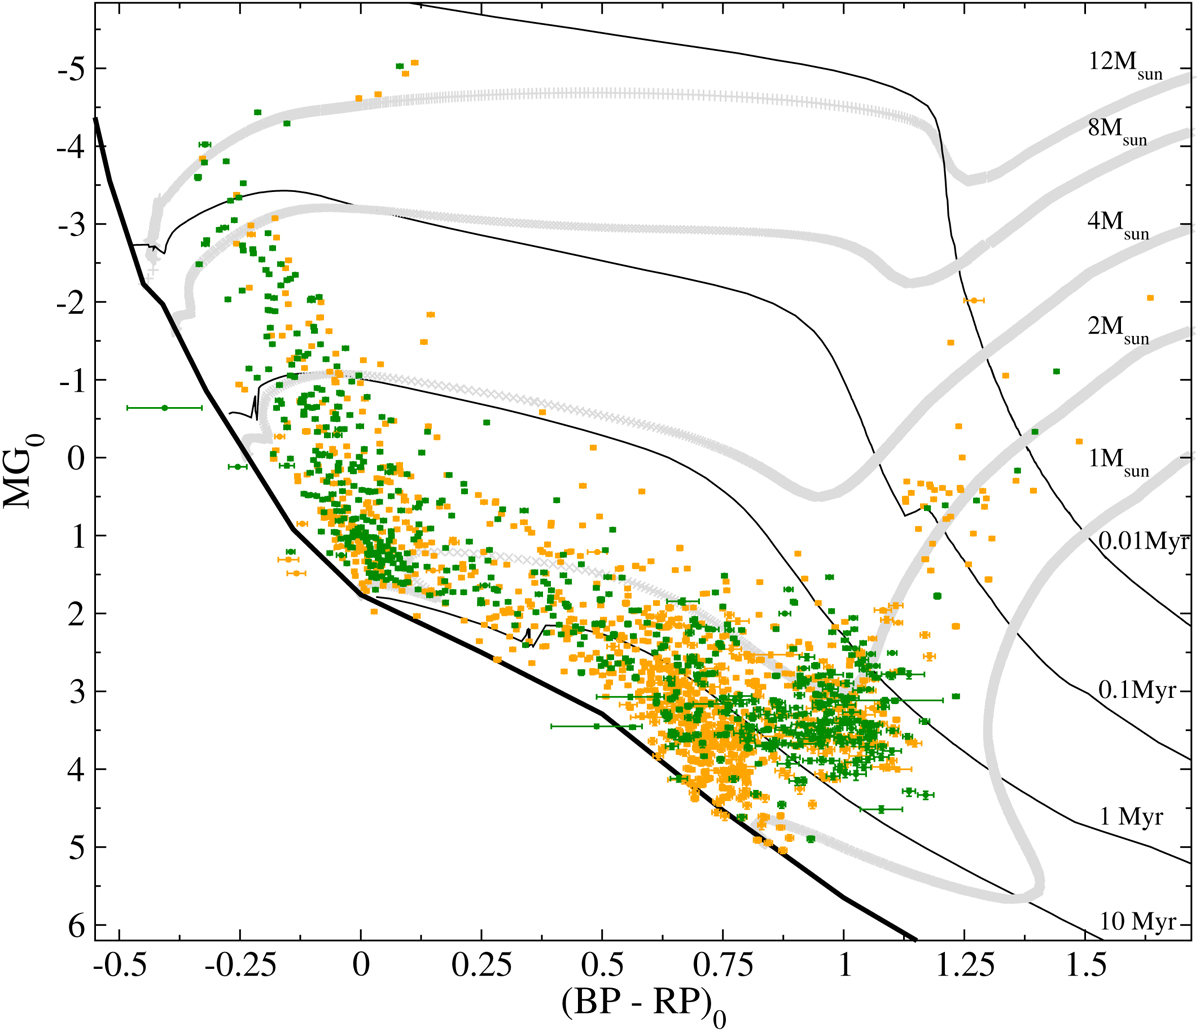
Fig. 3.
Download original image
Extinction-corrected Gaia CMD of NGC 6231. The high- and low-probability members are indicated with dark green and orange, as identified in Fig. 2. The stars plotted represent 90% and 91% of the high- and low-probability members, since extinction values are not available for the rest. The ZAMS locus is indicated with the solid black curve. Evolutionary tracks and PMS isochrones are overplotted in gray and black for the stellar masses and ages indicated.
Current usage metrics show cumulative count of Article Views (full-text article views including HTML views, PDF and ePub downloads, according to the available data) and Abstracts Views on Vision4Press platform.
Data correspond to usage on the plateform after 2015. The current usage metrics is available 48-96 hours after online publication and is updated daily on week days.
Initial download of the metrics may take a while.