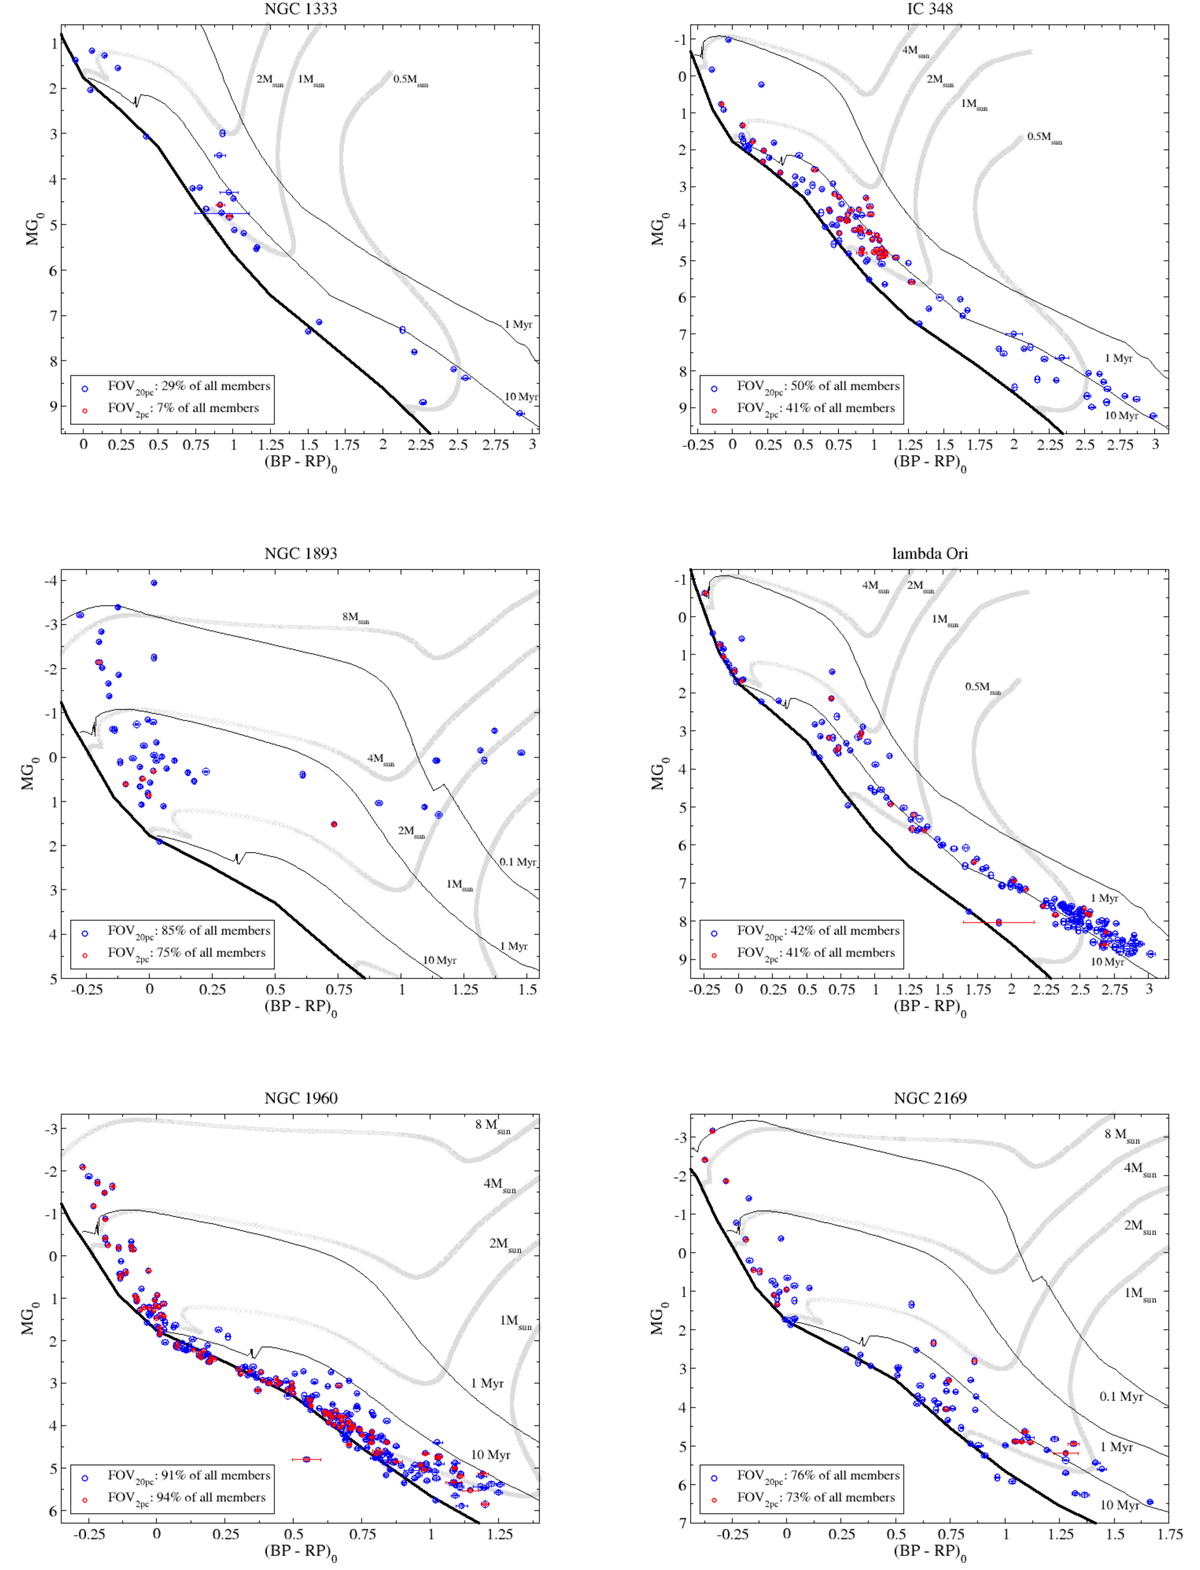
Fig. A.5.
Download original image
Extinction-corrected Gaia CMDs for the different clusters. The ZAMS locus is indicated with the solid black curve. Evolutionary tracks and PMS isochrones from Bressan et al. (2012) are overplotted in gray and black for the stellar masses and ages indicated. The representativeness of the diagrams is limited to the fraction of all members identified within FOV20pc and FOV2pc that have optical extinction estimates in Anders et al. (2022), which is indicated in the legends.
Current usage metrics show cumulative count of Article Views (full-text article views including HTML views, PDF and ePub downloads, according to the available data) and Abstracts Views on Vision4Press platform.
Data correspond to usage on the plateform after 2015. The current usage metrics is available 48-96 hours after online publication and is updated daily on week days.
Initial download of the metrics may take a while.