Fig. 2.
Download original image
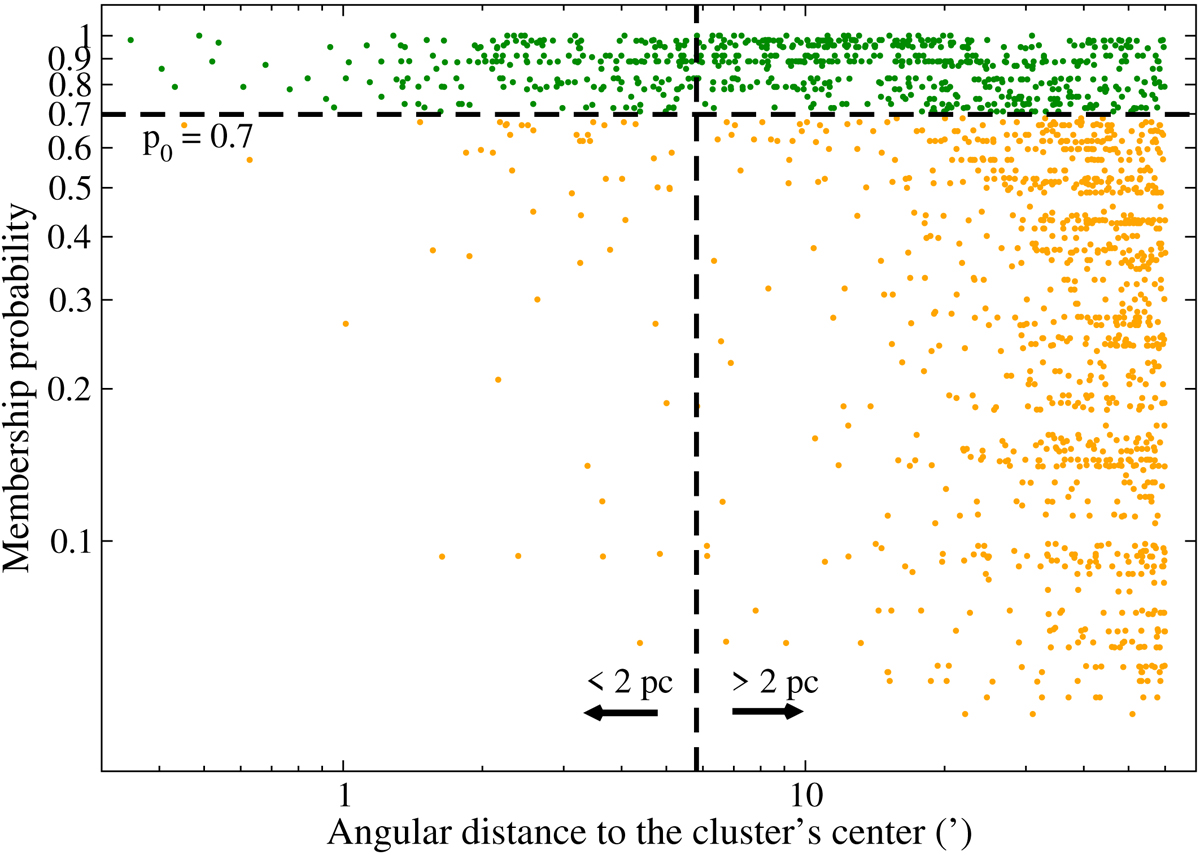
Membership probability against angular distance to the center of NGC 6231 for all members identified in this cluster (log-scale). The vertical dashed line separates the two subsamples, one closer and one farther than 2 pc from the cluster’s center. The horizontal dashed line indicates the probability threshold, p0, below which the KS test rules out the probability distributions of both subsamples being drawn from the same parent distribution. The resulting high- and low-probability members are indicated with dark green and orange, respectively.
Current usage metrics show cumulative count of Article Views (full-text article views including HTML views, PDF and ePub downloads, according to the available data) and Abstracts Views on Vision4Press platform.
Data correspond to usage on the plateform after 2015. The current usage metrics is available 48-96 hours after online publication and is updated daily on week days.
Initial download of the metrics may take a while.