Fig. A.4.
Download original image
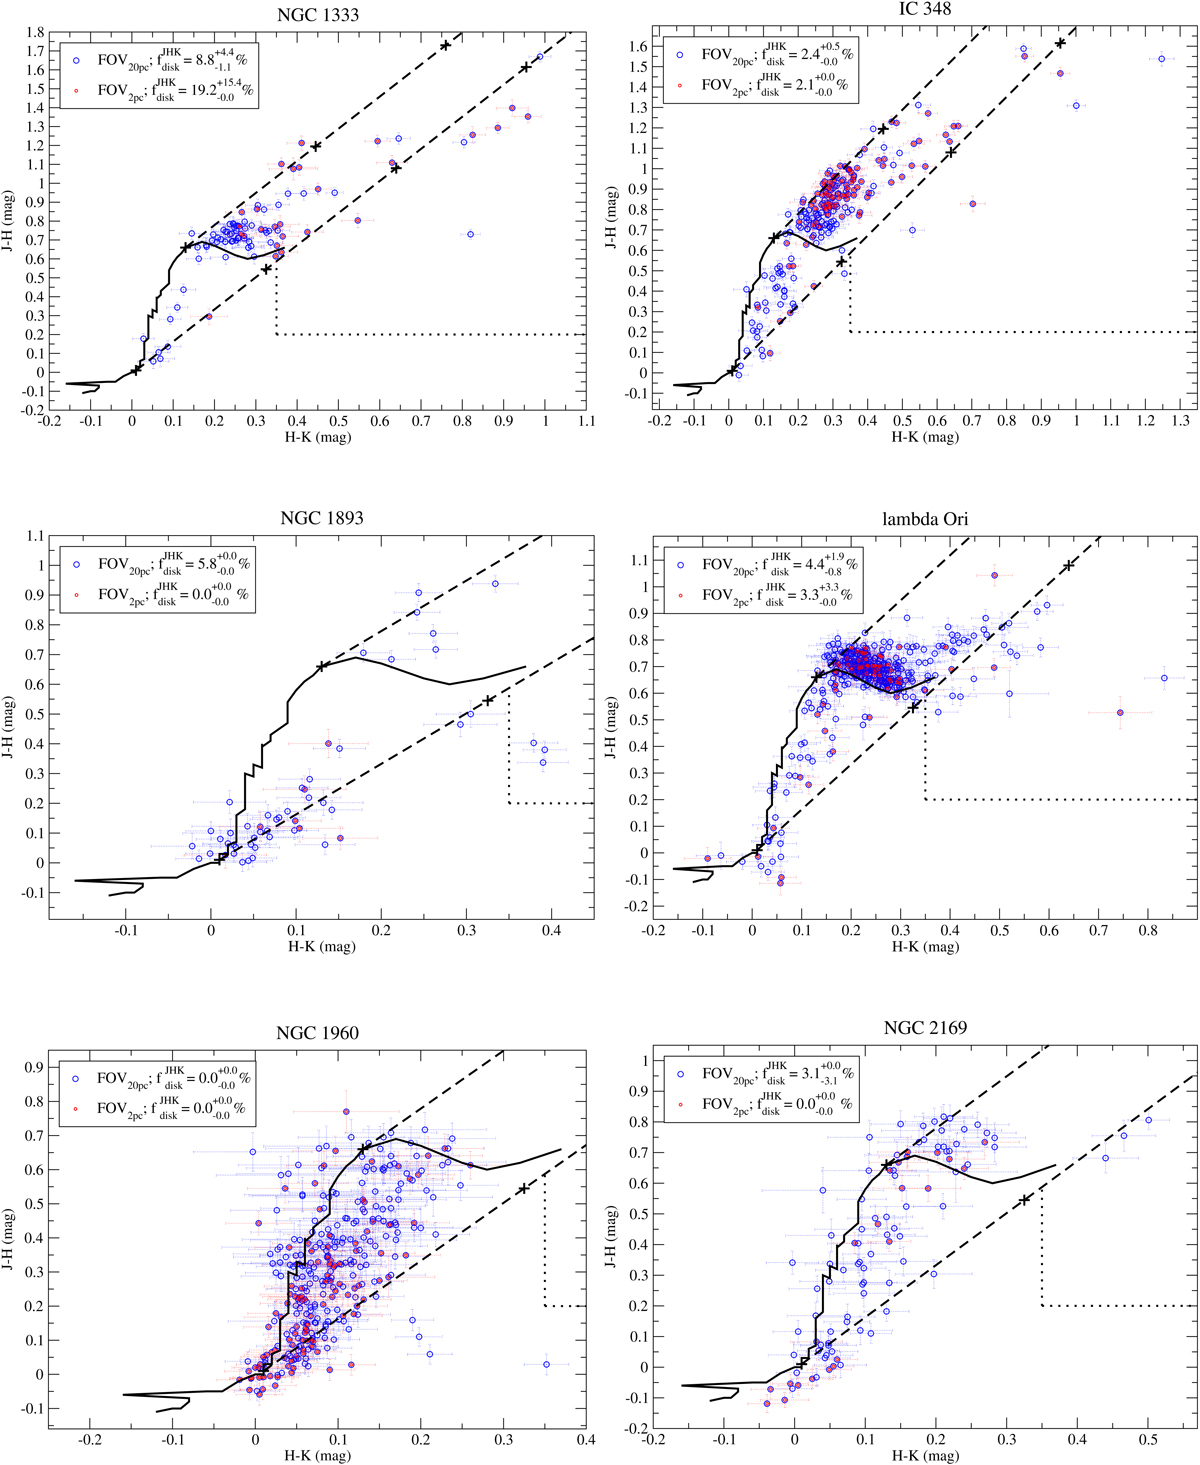
JHK color-color diagrams for the different clusters. In each panel, the solid line represents the expected position of non-extincted MS stars in the diagram, and the dashed lines the direction of the extinction vector and thus the rough boundaries for extincted MS stars (crosses within the dashed lines indicate an optical extinction increase of 5 magnitudes). Sources located to the right of the right-hand dashed line and within the dotted lines are considered disk stars. Inner disk fractions, as inferred from all identified members within FOV20pc and within FOV2pc, (blue and red symbols, respectively), are indicated in the legends.
Current usage metrics show cumulative count of Article Views (full-text article views including HTML views, PDF and ePub downloads, according to the available data) and Abstracts Views on Vision4Press platform.
Data correspond to usage on the plateform after 2015. The current usage metrics is available 48-96 hours after online publication and is updated daily on week days.
Initial download of the metrics may take a while.