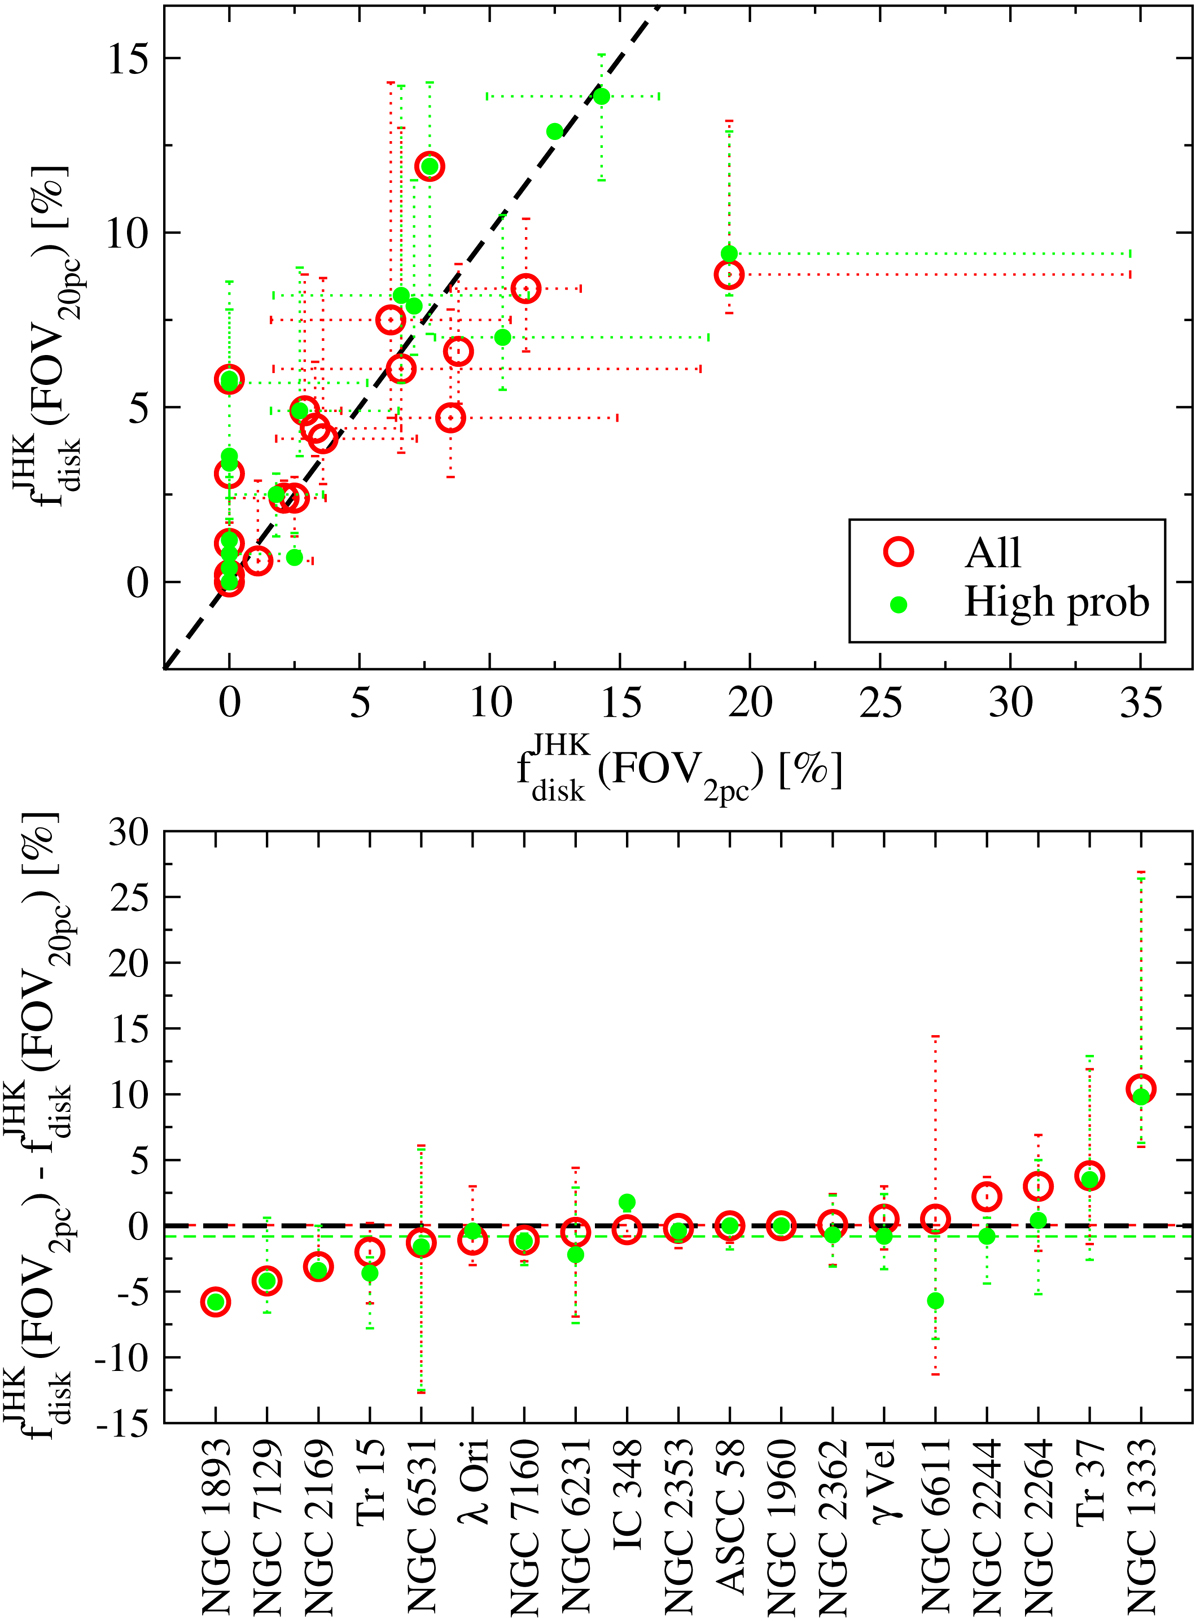
Fig. 1.
Download original image
Inner disk fractions from the compact and extended regions plotted against each other in the top panel, and their differences in the bottom panel. The red and green circles are results based on all members identified per cluster or on the high-probability members, respectively. The dashed black lines indicate equal values in both panels, and the mean differences are shown in the bottom panel with dashed red and green lines.
Current usage metrics show cumulative count of Article Views (full-text article views including HTML views, PDF and ePub downloads, according to the available data) and Abstracts Views on Vision4Press platform.
Data correspond to usage on the plateform after 2015. The current usage metrics is available 48-96 hours after online publication and is updated daily on week days.
Initial download of the metrics may take a while.