Fig. 9
Download original image
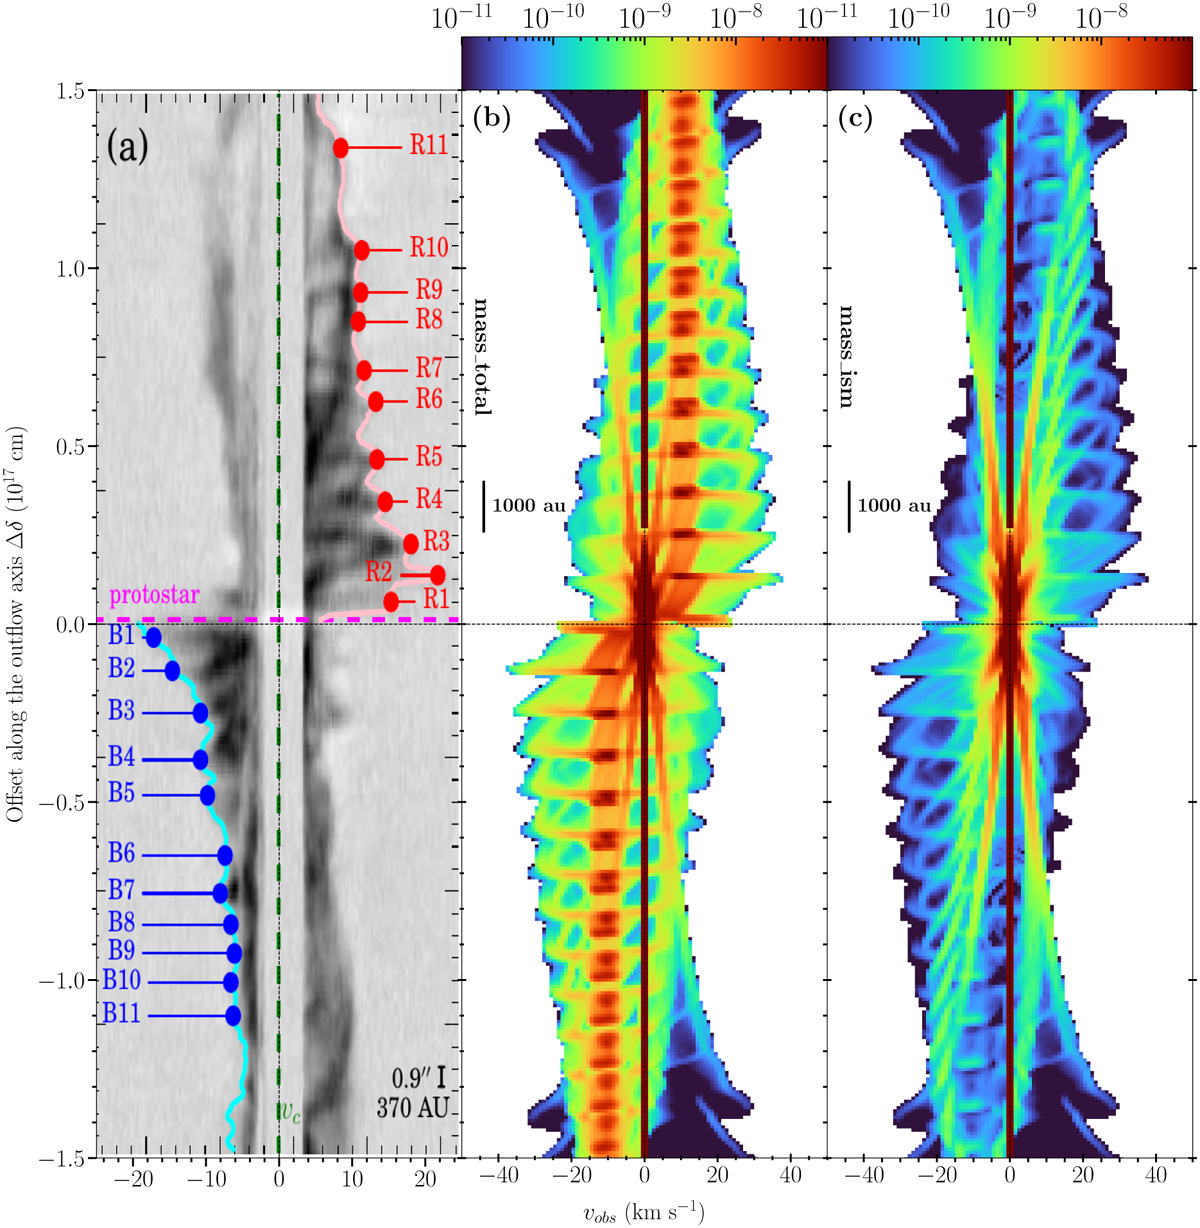
Observed and modeled longitudinal position-velocity (PV) diagrams in CARMA-7. (α) Longitudinal PV diagram of CARMA-7 inside a 374 au-wide cut along the outflow axis, as observed in 12Co(2–1) by Plunkett et al. (2015). (b) Synthetic longitudinal PV diagram along a 400 au-wide cut, at t = 500 yr, and inclination i= 85° from the line of sight. Parameters are the same as for the model shown in Fig. 5 except for a shorter jet variability period P = 30 yr. (c) Same as (b) but including only the core-originated material.
Current usage metrics show cumulative count of Article Views (full-text article views including HTML views, PDF and ePub downloads, according to the available data) and Abstracts Views on Vision4Press platform.
Data correspond to usage on the plateform after 2015. The current usage metrics is available 48-96 hours after online publication and is updated daily on week days.
Initial download of the metrics may take a while.