Open Access
Fig. 7
Download original image
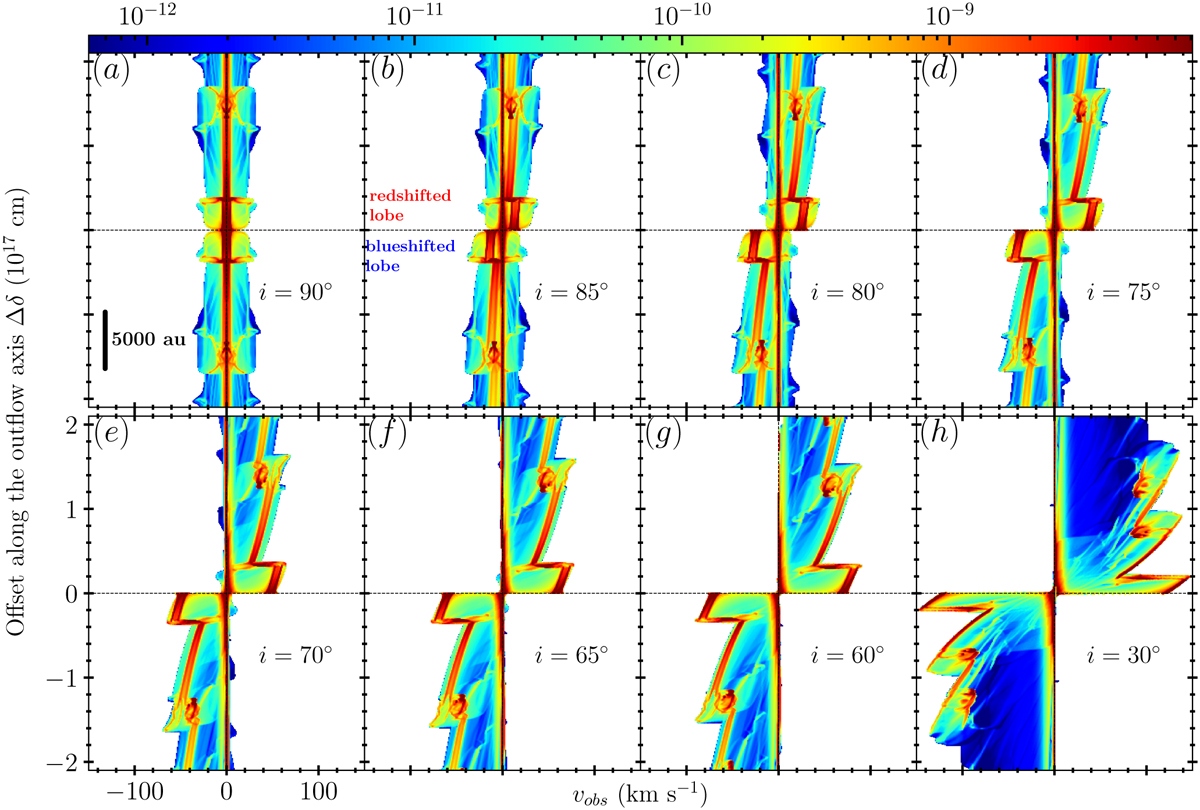
Longitudinal position-velocity diagrams along the flow axis, inferred from the simulation in Fig. 5 at an age t = 10000 yr, for different inclination angles, i, from the line of sight, ranging from 90° (edge-on) to 30°.
Current usage metrics show cumulative count of Article Views (full-text article views including HTML views, PDF and ePub downloads, according to the available data) and Abstracts Views on Vision4Press platform.
Data correspond to usage on the plateform after 2015. The current usage metrics is available 48-96 hours after online publication and is updated daily on week days.
Initial download of the metrics may take a while.