Fig. 6
Download original image
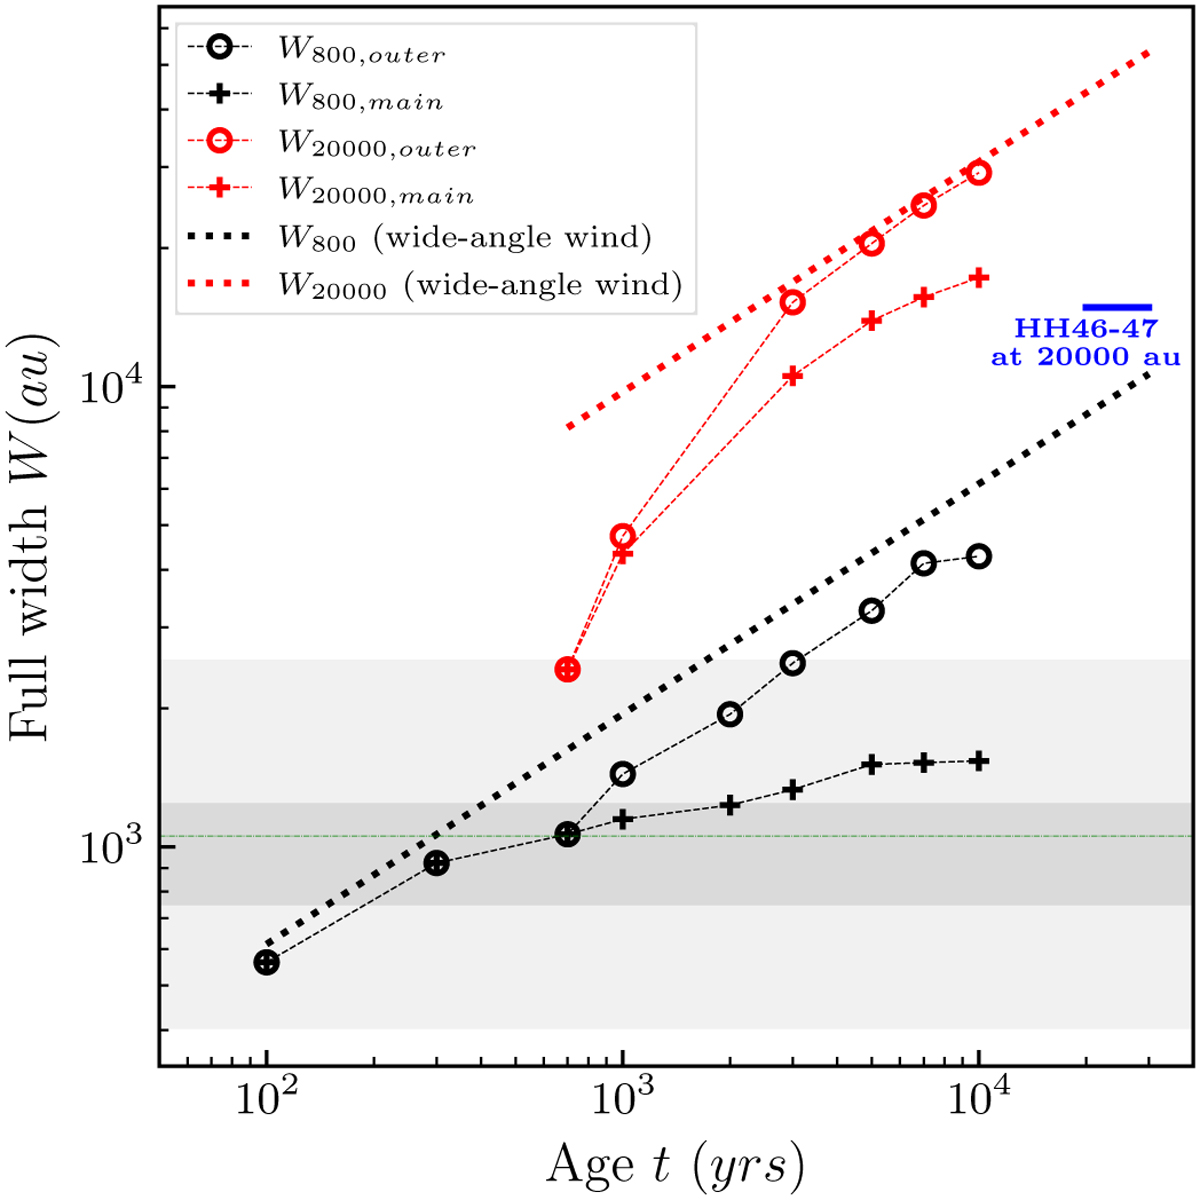
Temporal evolution in the simulation of Fig. 5 of the full width of the main shell (jet-ambient interface, crosses) and outer shell (forward shock, circles) measured at altitudes z = 800 au (black) and z = 20 000 au (red). Analytical predictions for the equivalent “modified X-wind” model of Lee et al. (2001) are shown as dotted black and red lines of slope tl/2 (see text). The full range of CO outflow widths observed at z = 800 au by Dutta et al. (2020) is indicated by the light grey band (with second and third quartiles in darker grey, and median as a thin green line). The full width of the HH46-47 outflow at z = 20 000 au, from Zhang et al. (2016), is shown in blue.
Current usage metrics show cumulative count of Article Views (full-text article views including HTML views, PDF and ePub downloads, according to the available data) and Abstracts Views on Vision4Press platform.
Data correspond to usage on the plateform after 2015. The current usage metrics is available 48-96 hours after online publication and is updated daily on week days.
Initial download of the metrics may take a while.