Fig. 11
Download original image
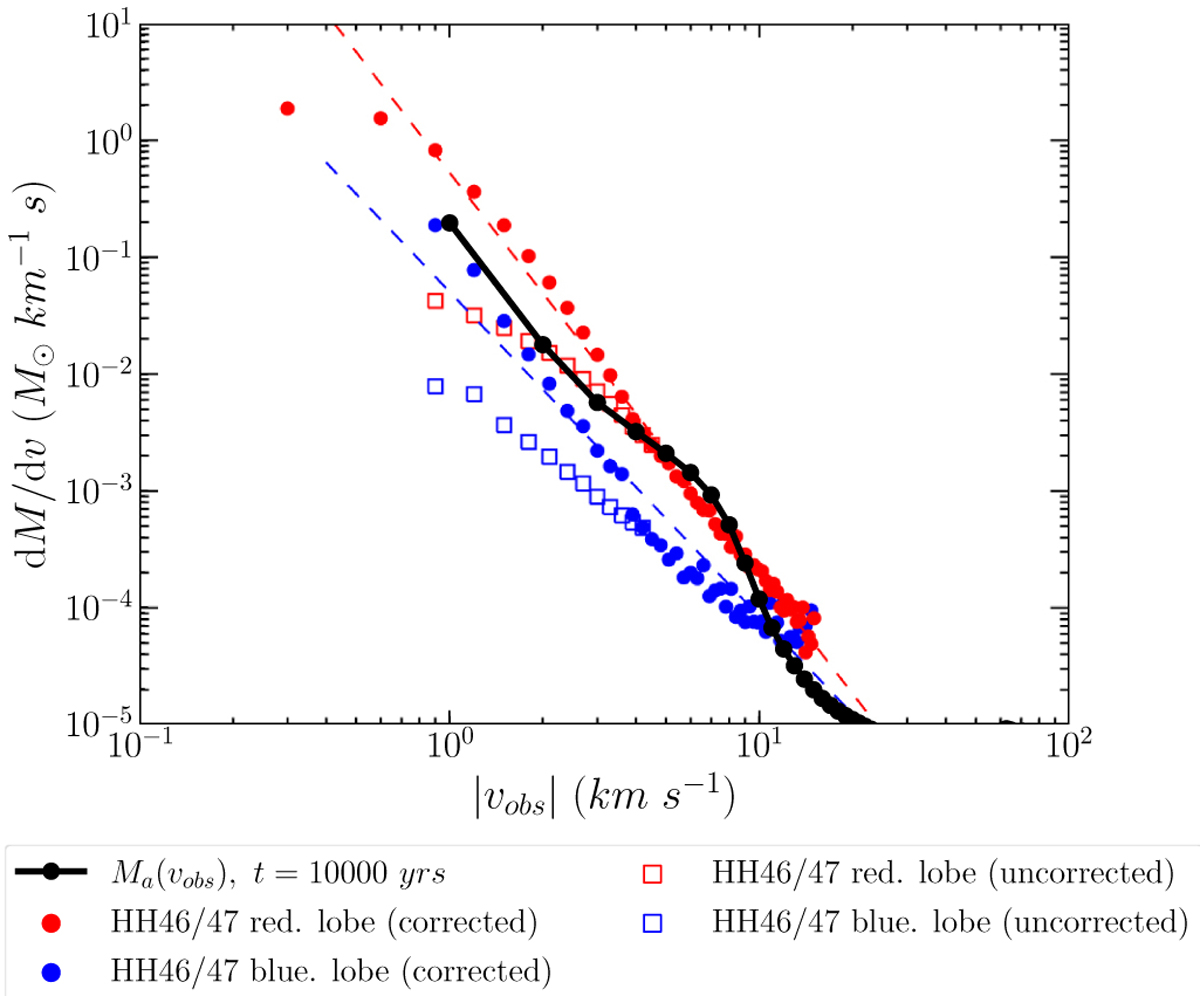
Simulated mass-velocity (MV) distribution of core-originated material at t = 10 000 yr from the jet-driven shell simulation in Figs.5 and 10, inclined byi= 55° from the line of sight (connected black symbols). Blue and red symbols show observed MV distributions in the blueshifted and redshifted lobes of the HH46-47 outflow, as derived by Zhang et al. (2016). Open squares assume optically thin CO emission, while filled circles include a velocity-dependent correction for optical depth (see text). The dashed lines show power-laws of slope γ = –3.4 (red) and γ = –2.7 (blue).
Current usage metrics show cumulative count of Article Views (full-text article views including HTML views, PDF and ePub downloads, according to the available data) and Abstracts Views on Vision4Press platform.
Data correspond to usage on the plateform after 2015. The current usage metrics is available 48-96 hours after online publication and is updated daily on week days.
Initial download of the metrics may take a while.