Fig. 8
Download original image
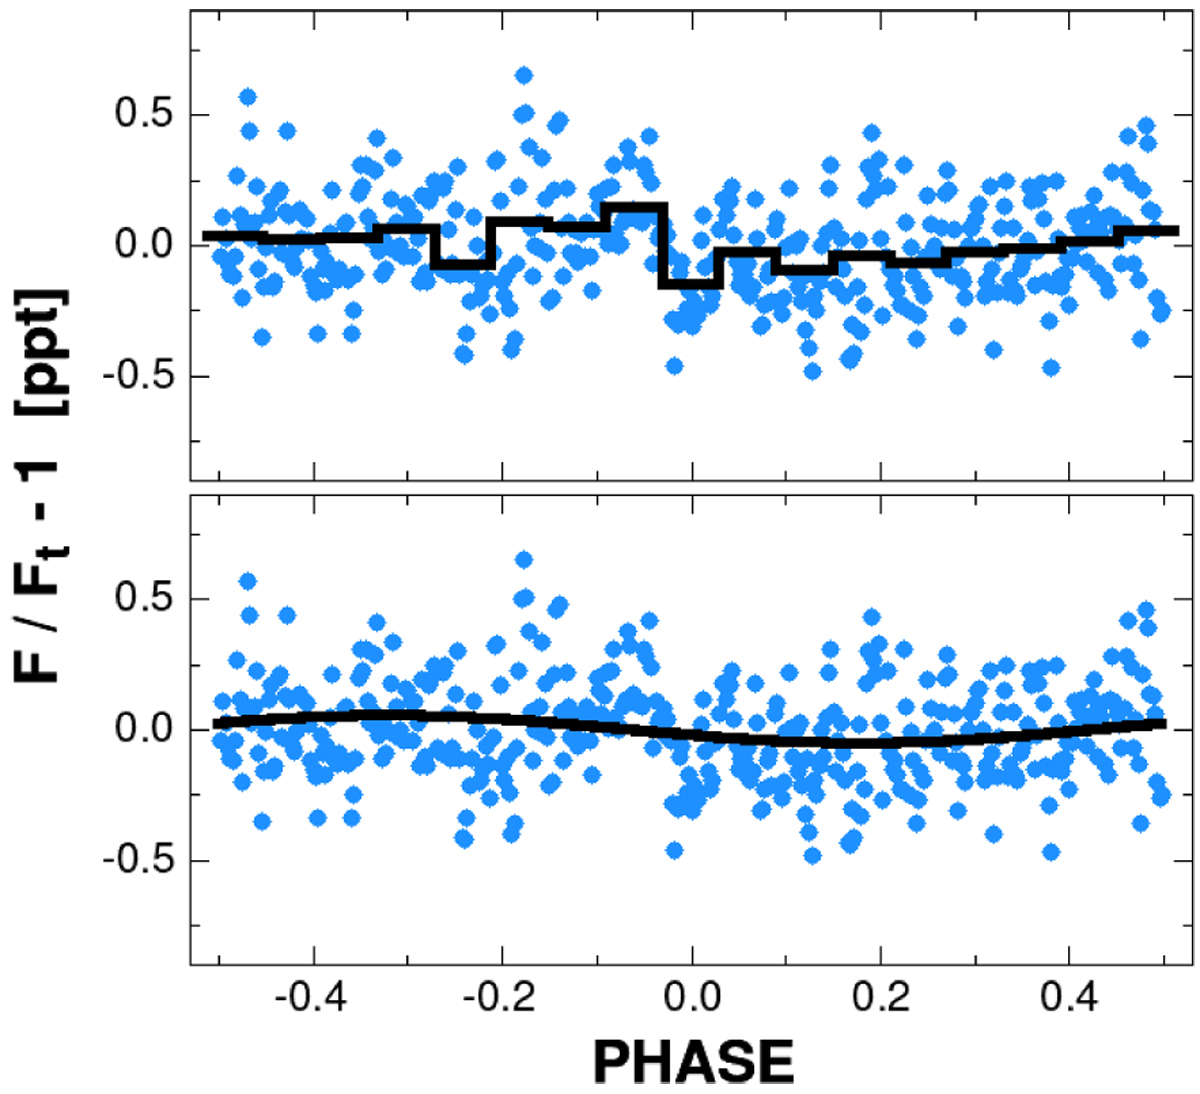
Phase-folded and binned light curve of WASP-5 for the full TESS dataset after dividing the PDC flux values by the transit and polynomial components. The upper and lower panels, respectively, show the bin and cosine models (black lines). The transit phase is shifted to −0.5 for better visibility of the neighborhood of the expected phase of the secondary eclipse.
Current usage metrics show cumulative count of Article Views (full-text article views including HTML views, PDF and ePub downloads, according to the available data) and Abstracts Views on Vision4Press platform.
Data correspond to usage on the plateform after 2015. The current usage metrics is available 48-96 hours after online publication and is updated daily on week days.
Initial download of the metrics may take a while.