Fig. 10
Download original image
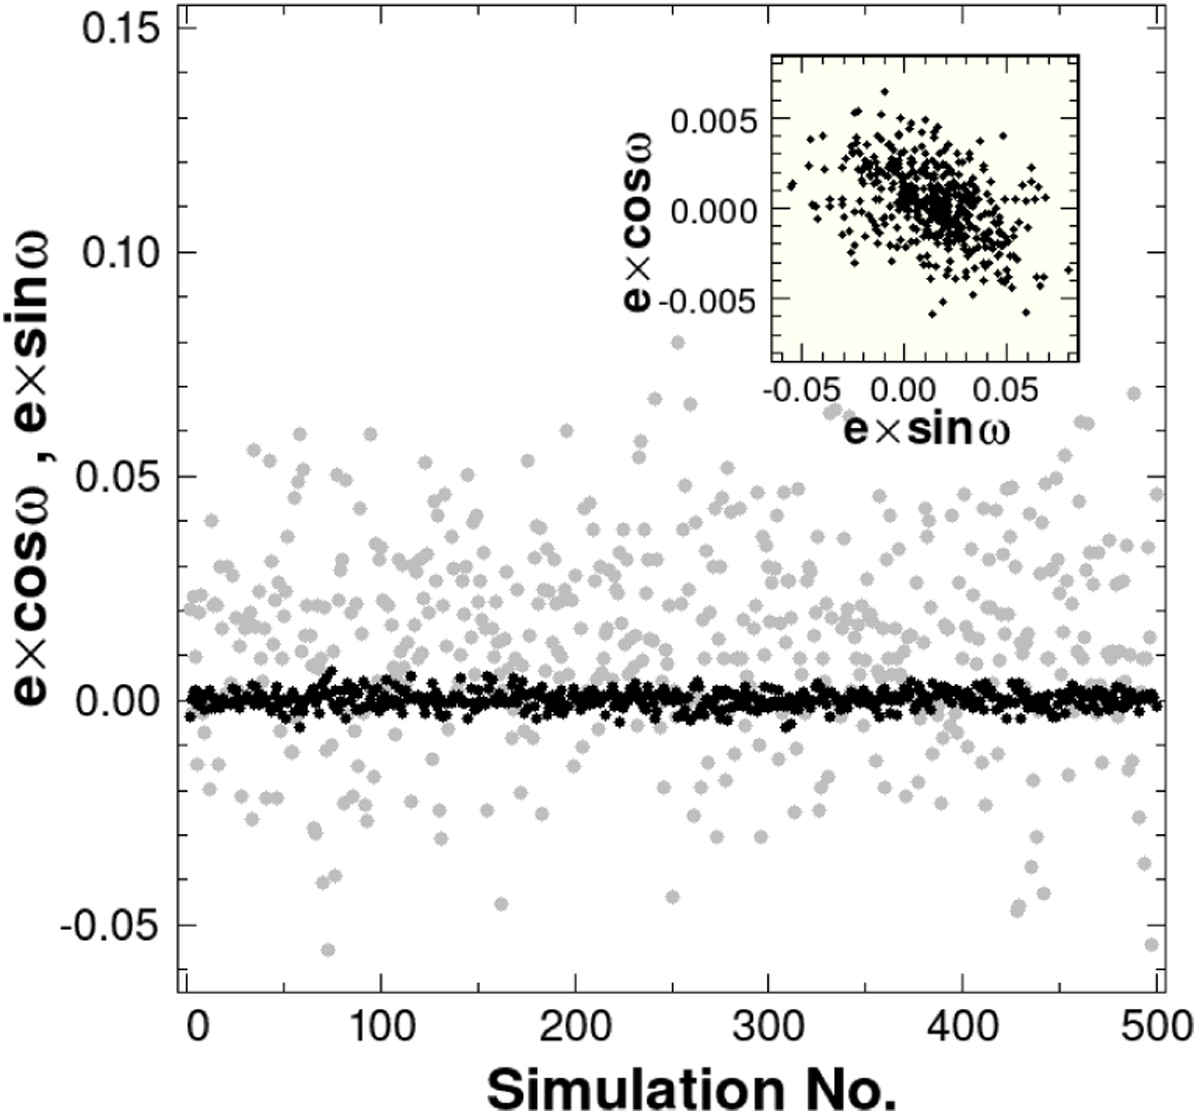
Eccentricity components obtained from the Monte Carlo simulations as described in the text. Gray and black dots, respectively, denote the e sin ω and e cos ω components. The inset shows the correlation between the two components, leading to a smaller error on the eccentricity as compared to that of the e sin ω component alone.
Current usage metrics show cumulative count of Article Views (full-text article views including HTML views, PDF and ePub downloads, according to the available data) and Abstracts Views on Vision4Press platform.
Data correspond to usage on the plateform after 2015. The current usage metrics is available 48-96 hours after online publication and is updated daily on week days.
Initial download of the metrics may take a while.