Open Access
Fig. A.1
Download original image
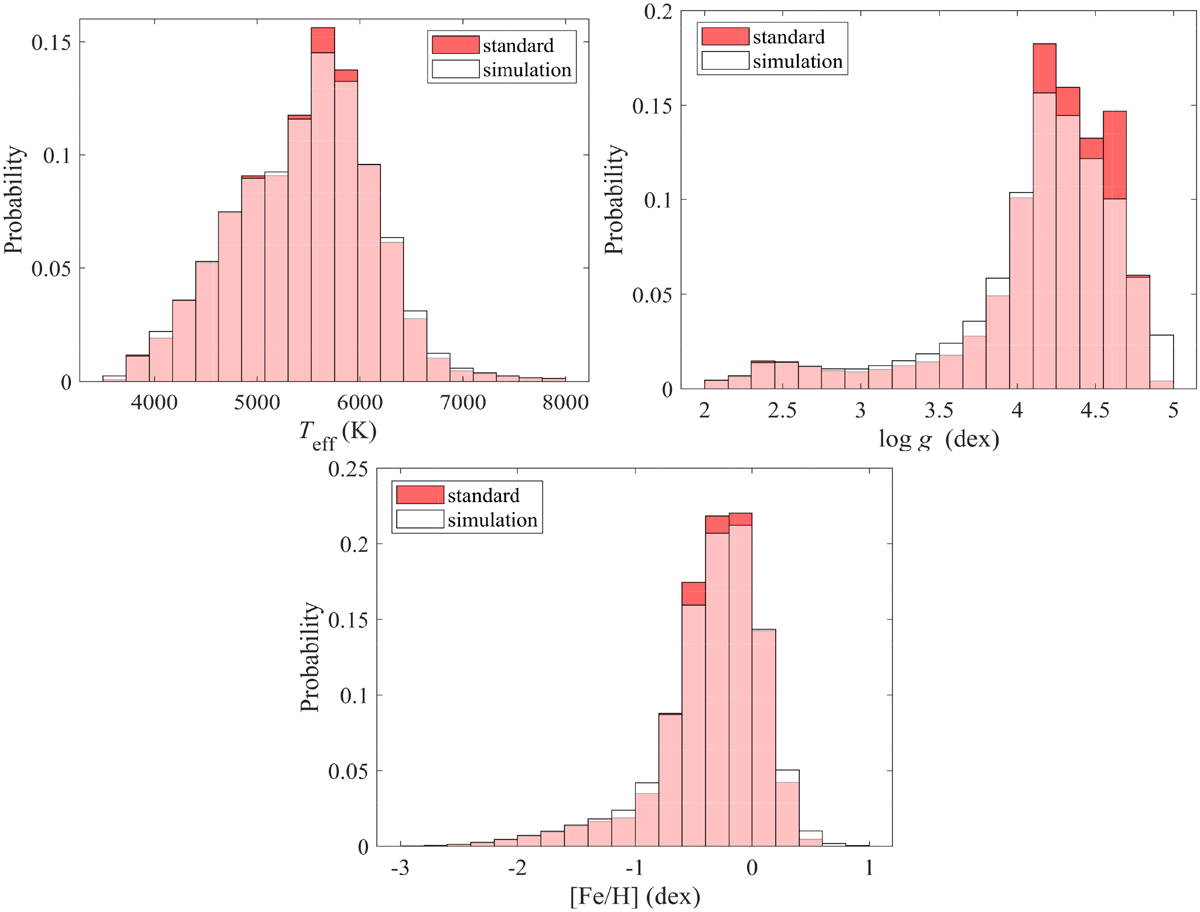
Stellar parameter distributions of the sample set. The red block shows the distribution of standard sample set. The white block shows the simulation distribution. The overlap is shown in pink (red+white). The y axis shows the probability.
Current usage metrics show cumulative count of Article Views (full-text article views including HTML views, PDF and ePub downloads, according to the available data) and Abstracts Views on Vision4Press platform.
Data correspond to usage on the plateform after 2015. The current usage metrics is available 48-96 hours after online publication and is updated daily on week days.
Initial download of the metrics may take a while.