Open Access
Fig. 3
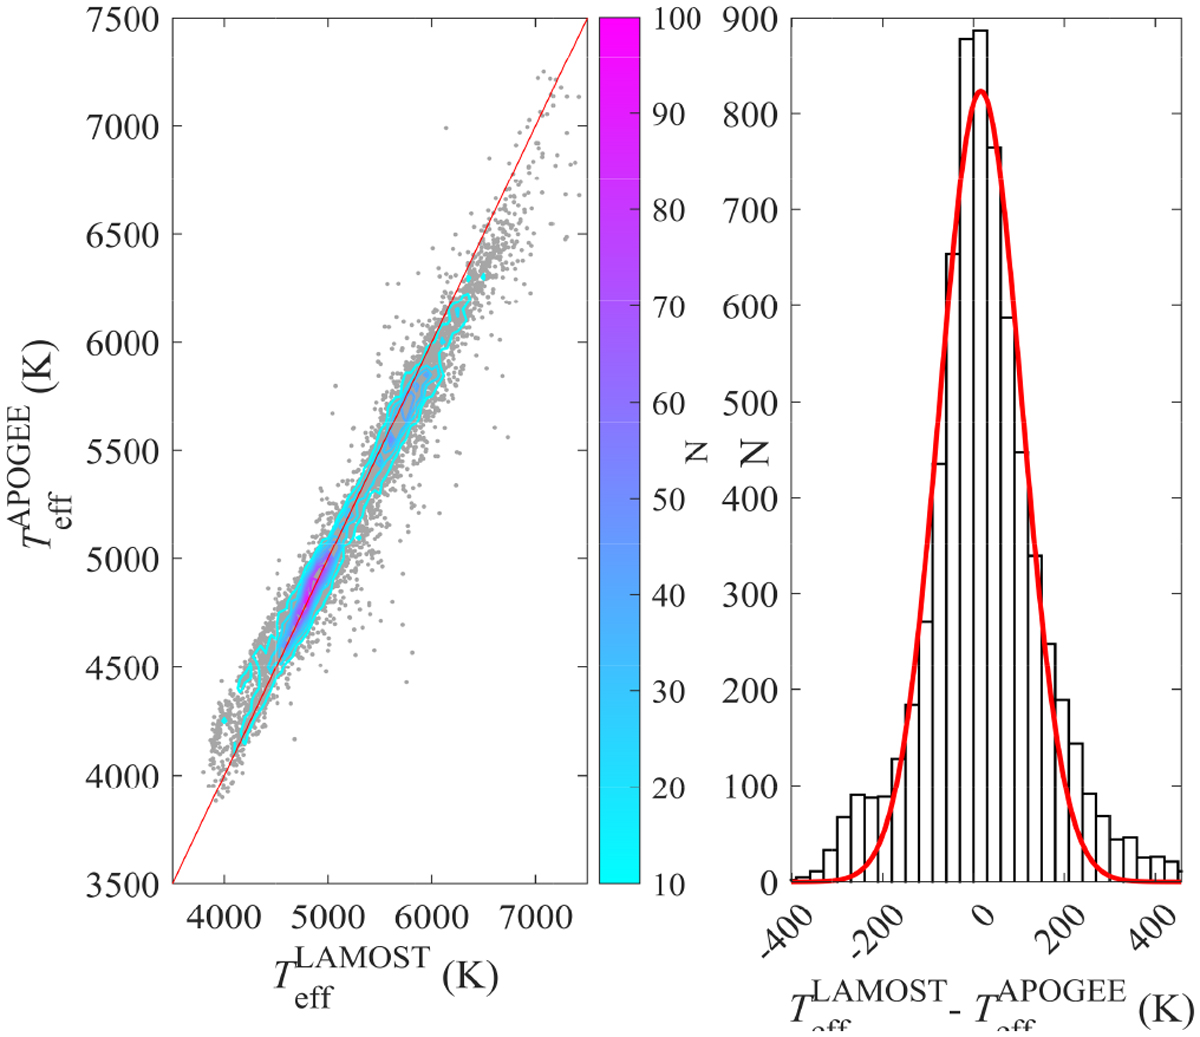
Download original image
One-to-one correlation of Teff between APOGEE and LAM- OST. Data points are in gray. The color bar is the density contours. The Gaussian fit of the residual is presented in the right panel. The mean of this normal distribution is −27.7873, and its standard deviation is 143.2126.
Current usage metrics show cumulative count of Article Views (full-text article views including HTML views, PDF and ePub downloads, according to the available data) and Abstracts Views on Vision4Press platform.
Data correspond to usage on the plateform after 2015. The current usage metrics is available 48-96 hours after online publication and is updated daily on week days.
Initial download of the metrics may take a while.