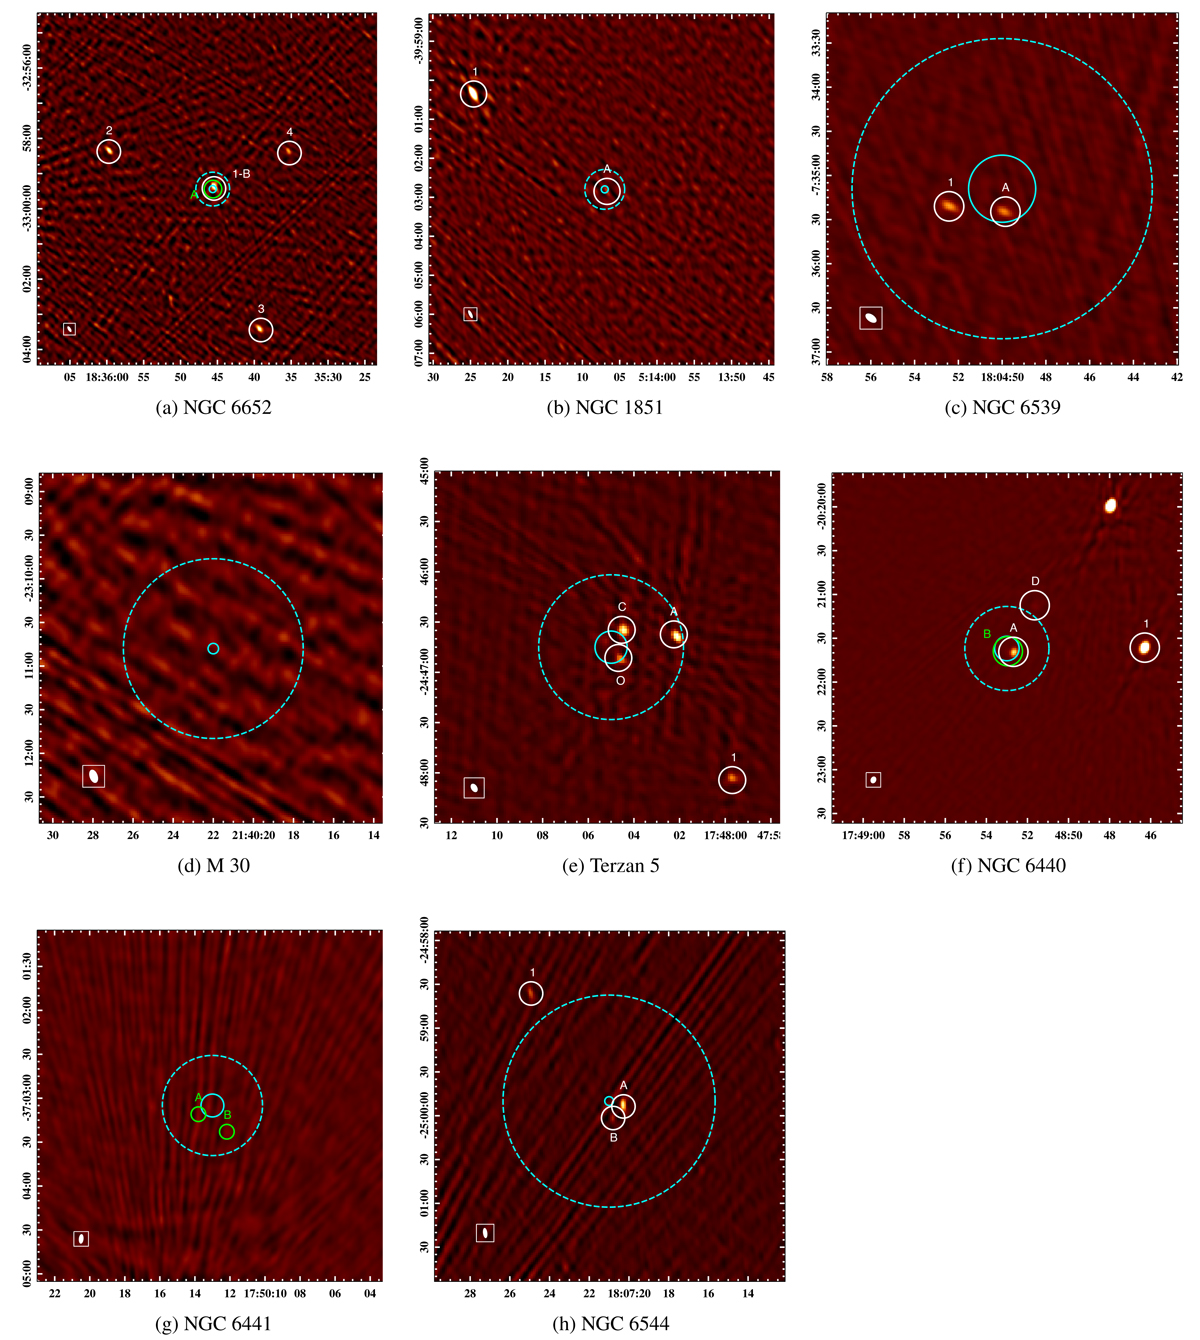
Fig. 8.
Download original image
Radio Images of 8 GCs observed with uGMRT. X and Y axis represent RA (hh:mm:ss) and Dec (°:′:″), respectively. The cyan-coloured circle shows the core radius, and the dashed cyan circle shows the half-mass radius. Sources circled in white are the detections in the image, while green-coloured circles show sources visible in the PA data but not in the radio image. In the lower left corner, we display the size and orientation of the imaging beam.
Current usage metrics show cumulative count of Article Views (full-text article views including HTML views, PDF and ePub downloads, according to the available data) and Abstracts Views on Vision4Press platform.
Data correspond to usage on the plateform after 2015. The current usage metrics is available 48-96 hours after online publication and is updated daily on week days.
Initial download of the metrics may take a while.