Open Access
Fig. 5.
Download original image
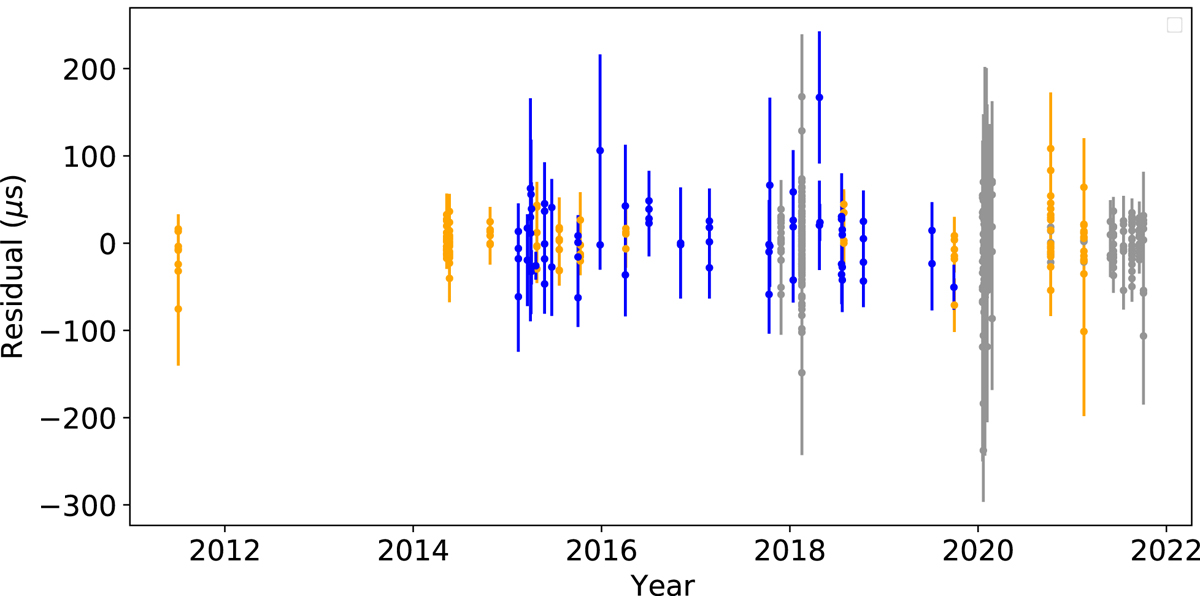
Residuals obtained with phase-connected solution of NGC 6652B in Table 3. Grey points are ToAs derived from data taken at frequencies below 1000 MHz, while orange points represent GBT ToAs derived from L-band data within 1000–1700 MHz, and blue points show S-band data above 1700 MHz.
Current usage metrics show cumulative count of Article Views (full-text article views including HTML views, PDF and ePub downloads, according to the available data) and Abstracts Views on Vision4Press platform.
Data correspond to usage on the plateform after 2015. The current usage metrics is available 48-96 hours after online publication and is updated daily on week days.
Initial download of the metrics may take a while.