Fig. 9.
Download original image
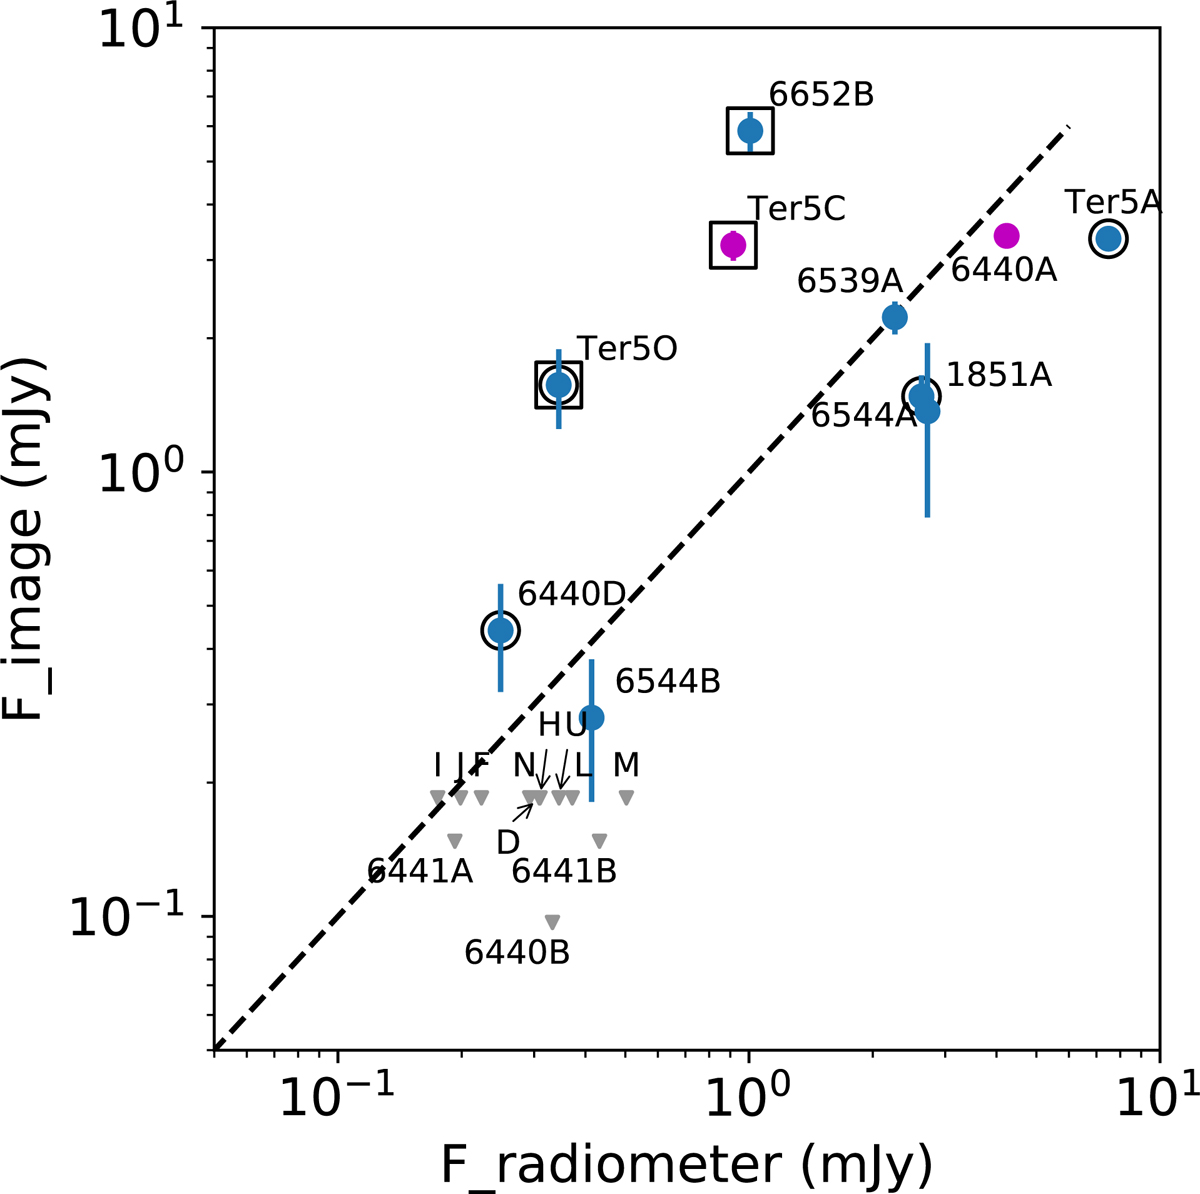
Comparison of flux density estimates from radio images and folded profiles at 400 MHz for pulsars NGC 1851A, NGC 6544A, NGC 6544B, NGC 6652B, and NGC 6539A, and at 650 MHz for the rest. Blue points represent binary systems, while magenta points represent isolated systems. Pulsars in eclipsing binary systems are marked with black circles, and pulsars with large duty cycles are marked with squares. Points in grey represent the upper limits for pulsars with no measured flux in imaging. The dashed line represents the linear expected trend. The only factor correlating with an imaging flux excess is the large duty cycle.
Current usage metrics show cumulative count of Article Views (full-text article views including HTML views, PDF and ePub downloads, according to the available data) and Abstracts Views on Vision4Press platform.
Data correspond to usage on the plateform after 2015. The current usage metrics is available 48-96 hours after online publication and is updated daily on week days.
Initial download of the metrics may take a while.