Fig. 6
Download original image
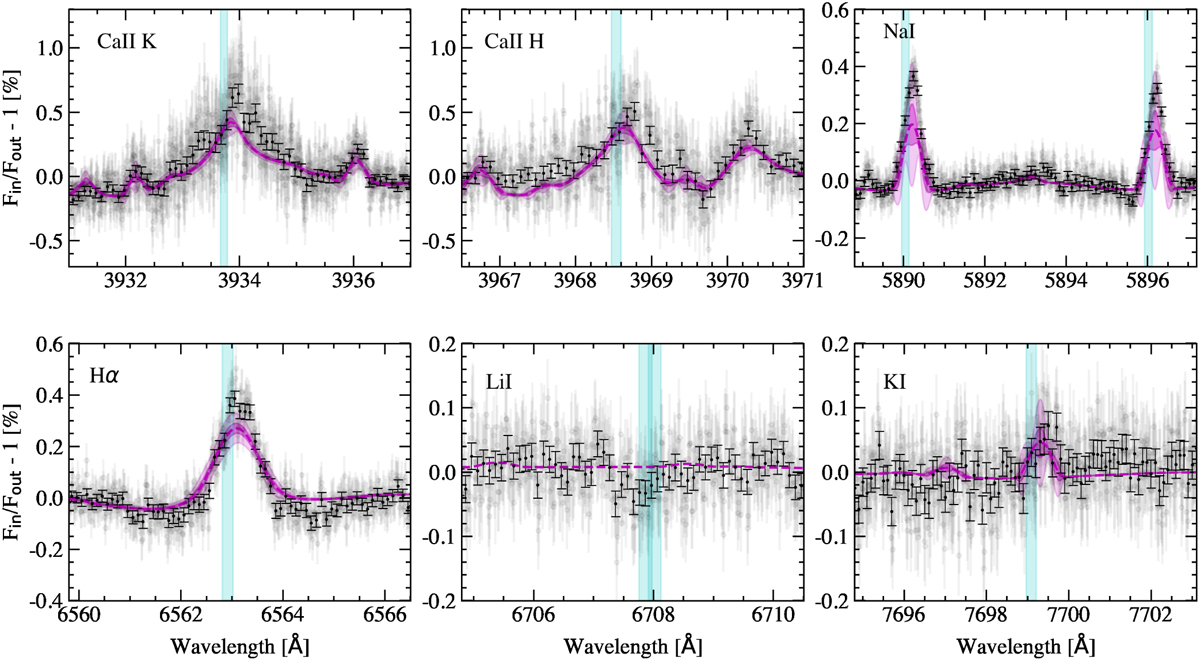
Transmission spectrum of MASCARA-1b around single lines, after combining the two nights of observation. In grey we show the original sampling of the data and in black the data binned by 0.1 Å. The width of the vertical light blue region indicates the uncertainty of υsys, that is, the position where the signals from the exoplanet atmosphere are expected (we note that the Li I is a doublet). The estimated models describing the RM and CLV effects on the transmission spectrum and their 1er and 3σ uncertainties are shown in violet.
Current usage metrics show cumulative count of Article Views (full-text article views including HTML views, PDF and ePub downloads, according to the available data) and Abstracts Views on Vision4Press platform.
Data correspond to usage on the plateform after 2015. The current usage metrics is available 48-96 hours after online publication and is updated daily on week days.
Initial download of the metrics may take a while.