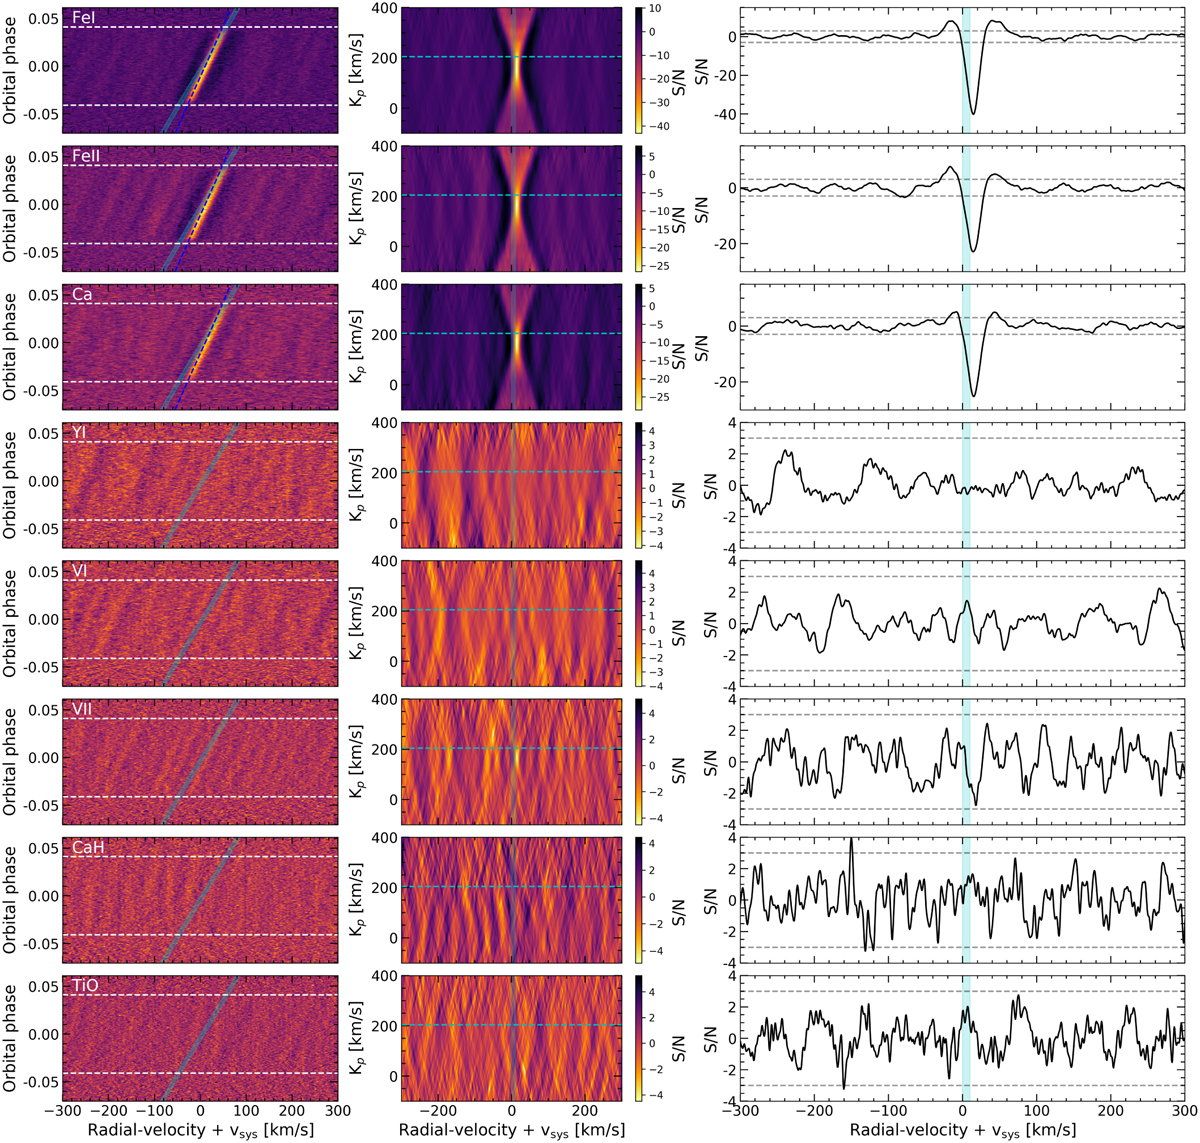
Fig. 5
Download original image
MASCARA-1b cross-correlation results obtained with atmospheric models of different species computed with petitRADTRANS. Each row shows the results for one species. Left column: cross-correlation maps. The first and last contacts of the transit are shown in horizontal dashed white lines. The light cyan region shows the planet radial-velocity paths considering the different possible υsys values for this star (~3–11 km s−1) based on literature measurements and the calculations performed here and the dashed blue line indicates the radial-velocity path of the Doppler shadow. Middle column: Kp − υsys map. The horizontal dashed line indicates the expected Kp at 204.2 km s−1. The colour bar shows the S/N. Right column: combined in-transit CCFs after correcting the planet radial velocities. The horizontal grey dashed lines indicate the ±3σ level. The radial velocities (horizontal axis) of these results do not consider the systemic velocity correction. The strong features observed in the Fe I, Fe II, and Ca I panels correspond to the Doppler shadow.
Current usage metrics show cumulative count of Article Views (full-text article views including HTML views, PDF and ePub downloads, according to the available data) and Abstracts Views on Vision4Press platform.
Data correspond to usage on the plateform after 2015. The current usage metrics is available 48-96 hours after online publication and is updated daily on week days.
Initial download of the metrics may take a while.