Fig. 4
Download original image
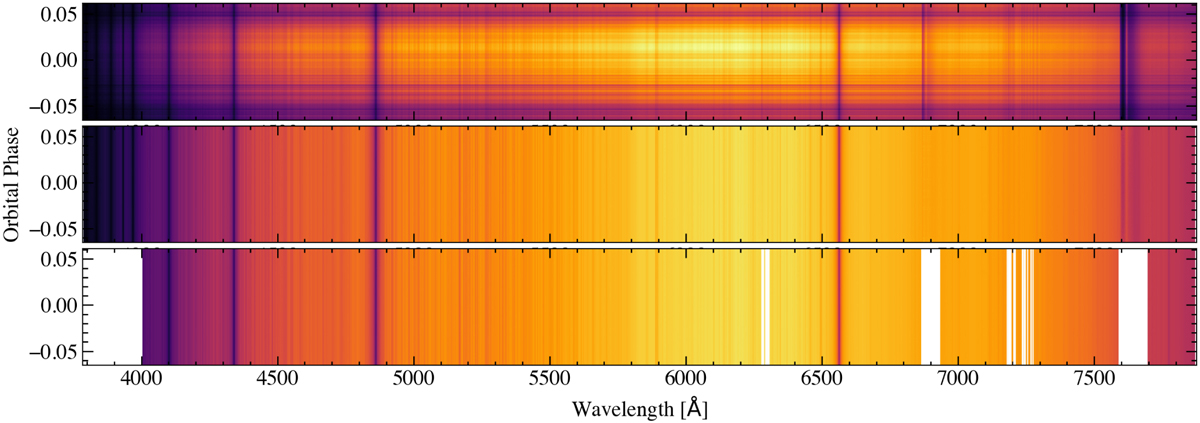
Steps applied to the observations before the cross-correlation analysis. As an example, we show the data of the first night. Top panel: original time series. Middle panel: time series obtained after correcting trie telluric contamination and normalising all spectra to the same continuum level as presented in Merritt et al. (2020). Bottom panel: time series of spectra after masking the columns of pixels affected by telluric residuals and the region below 4000 Å due to a lower S/N
Current usage metrics show cumulative count of Article Views (full-text article views including HTML views, PDF and ePub downloads, according to the available data) and Abstracts Views on Vision4Press platform.
Data correspond to usage on the plateform after 2015. The current usage metrics is available 48-96 hours after online publication and is updated daily on week days.
Initial download of the metrics may take a while.