Fig. A.3
Download original image
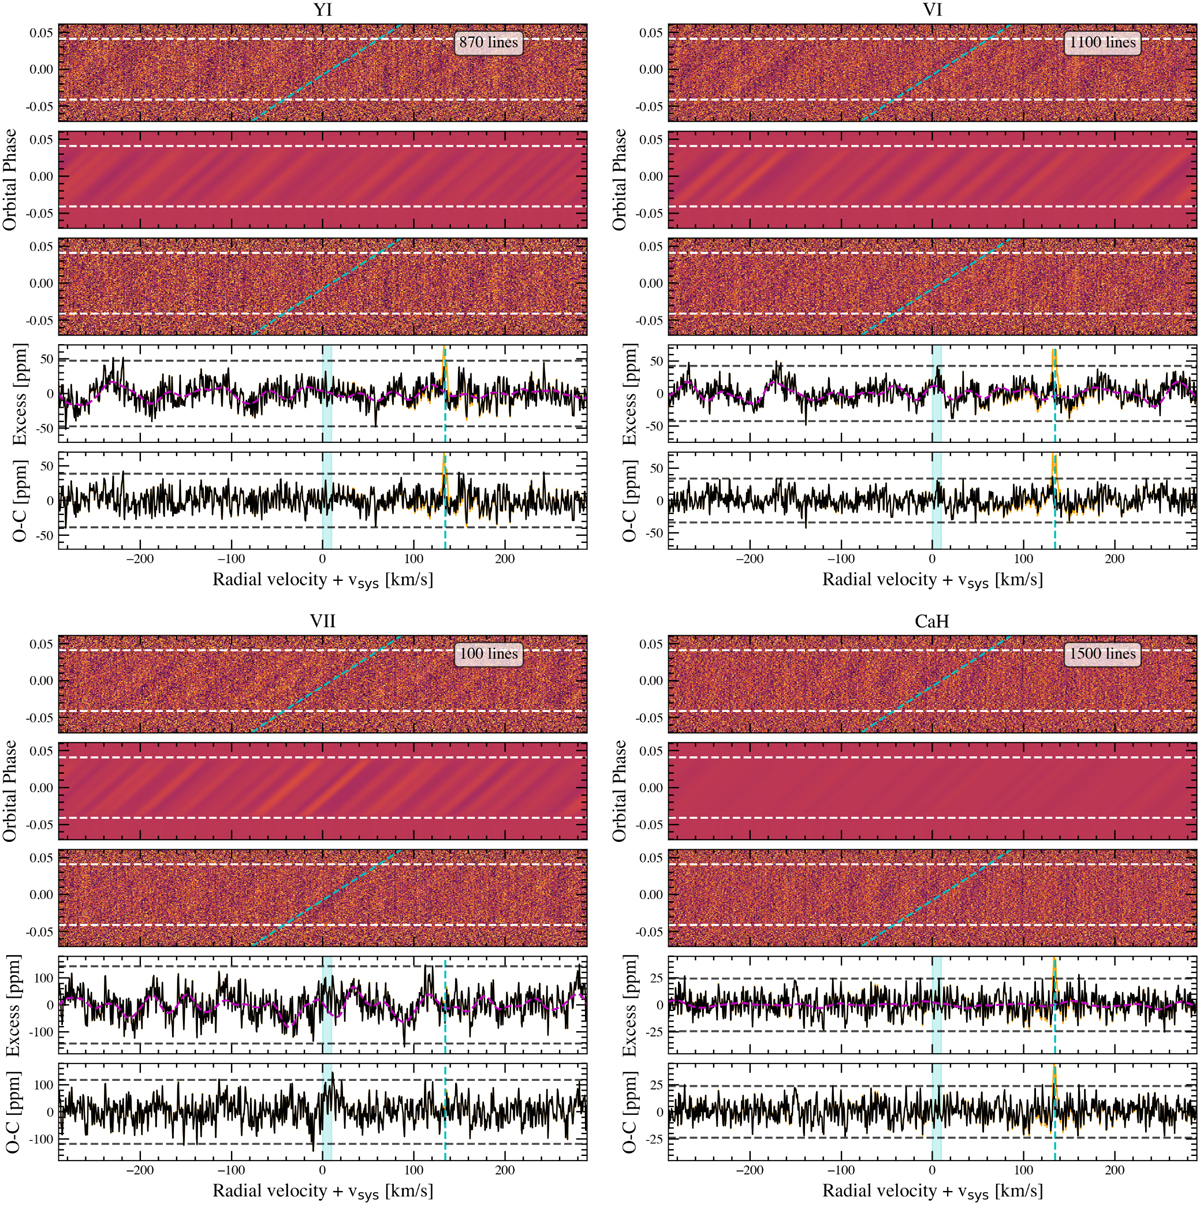
Cross-correlation results of Y I, V I, V II, and CaH obtained with a binary mask including a particular number of strong spectral lines (see Fig. A.2). Each panel corresponds to one species, and the number of lines used in the binary mask is indicated in the top right corner of each panel. First row (top): Cross-correlation maps. Second row: Cross-correlation maps obtained with the modelled spectra containing the RM and CLV effects on the stellar lines. Third row: Cross-correlation maps after subtracting the models (second row) to the observations (first row). The white horizontal lines indicate the first and last contacts of the transit. The dashed cyan lines indicate the planet radial-velocity change during the observations assuming υsys = 9.3 km s−1. Forth row: Combination of the in-transit results in the planet rest frame before the model subtraction (first row). The violet line shows the expected RM and CLV effect deformation of the lines in this region. Fifth row: Combination of the in-transit results in the planet rest frame after the model subtraction (third row). The ±3σ noise level is shown in horizontal dashed black lines. The orange line is the cross-correlation result including the injected atmospheric signal at +135 km s−1, whose position is indicated with a vertical dashed cyan line. The light blue region shows the υsys range where the signal from exoplanet atmosphere is expected.
Current usage metrics show cumulative count of Article Views (full-text article views including HTML views, PDF and ePub downloads, according to the available data) and Abstracts Views on Vision4Press platform.
Data correspond to usage on the plateform after 2015. The current usage metrics is available 48-96 hours after online publication and is updated daily on week days.
Initial download of the metrics may take a while.