Free Access
Fig. 6.
Download original image
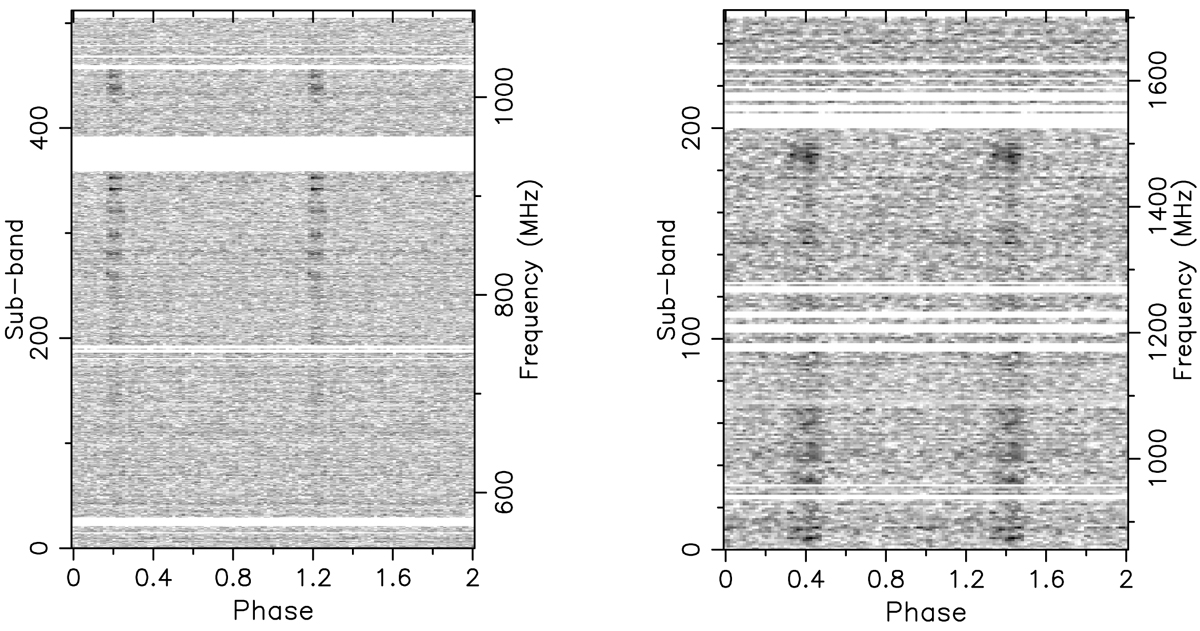
Example of flux density variations as seen in the frequency domain in NGC 1851M in the UHF band over ∼30 min of integration time (left panel) and in NGC 1851B in the L band over ∼1 h of integration time (right panel).
Current usage metrics show cumulative count of Article Views (full-text article views including HTML views, PDF and ePub downloads, according to the available data) and Abstracts Views on Vision4Press platform.
Data correspond to usage on the plateform after 2015. The current usage metrics is available 48-96 hours after online publication and is updated daily on week days.
Initial download of the metrics may take a while.