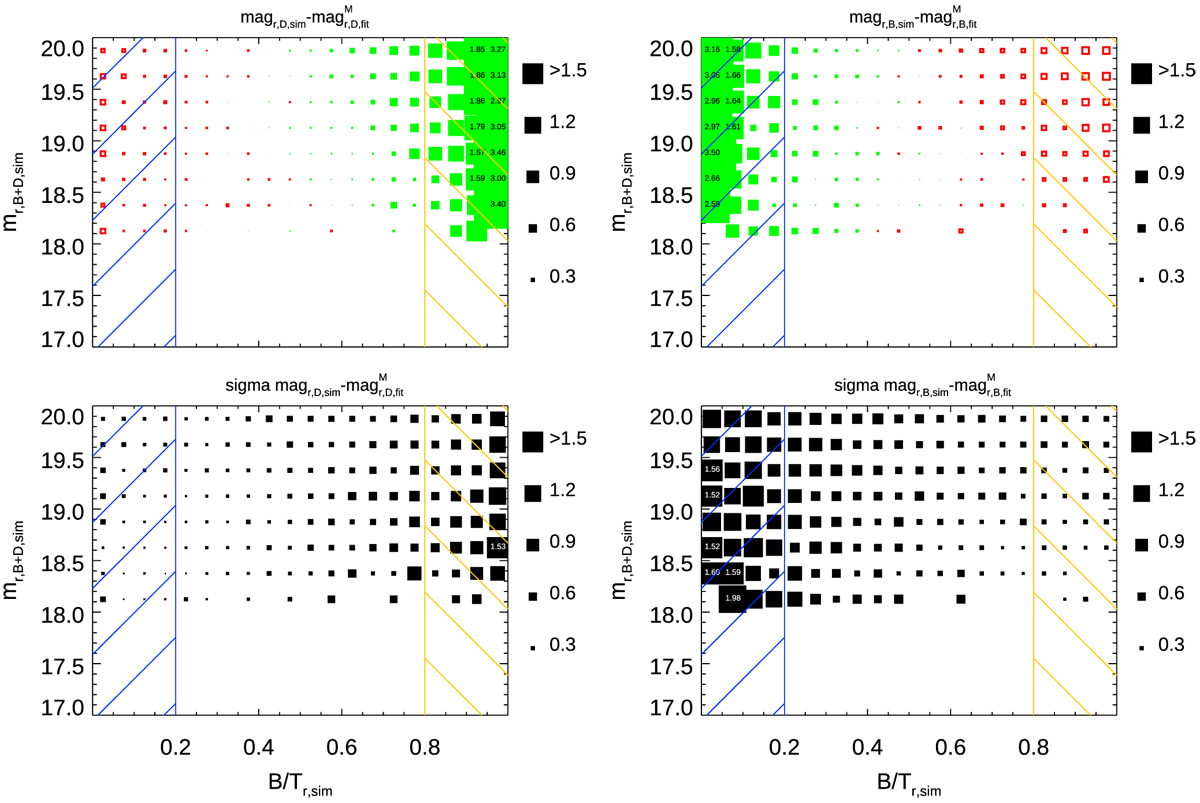
Fig. 7
Download original image
Recovery of component magnitudes as a function of B/T and input magnitude mr,B+D,sim. Top left: disk magnitude average offsets, mr,D,sim – mr,D,fit, in multi-band fits. The symbol size indicates the magnitude of the offset according to the legend on the right, where small symbols indicate small offsets and large symbols indicate large offsets, with the solid green and open red squares reflecting positive (fit too bright) and negative (fit too faint) values, respectively. Bottom left: standard deviation of the same value (smaller symbols represent less scatter). As discussed in the text, the mr,D can be well recovered as long as (B/T)r,sim < 0.8. In both plots, the blue hashed area indicates galaxies with (B/T)r,sim < 0.2, what we term ‘pure disks’, and the orange hashed area indicates galaxies with (B/T)r,sim > 0.8, in other words ‘pure spheroids’. Right column: same plots for bulge magnitudes, mr,B,Sim – mr,B,fit. These can be well recovered as long as (B/T)r,sim > 0.2. Small numbers indicate the actual value in those bins with a systematic offset larger than 1.5 magnitudes. We only show bins with more than 20 objects in this and all similar plots, to ensure reasonable number statistics in each bin.
Current usage metrics show cumulative count of Article Views (full-text article views including HTML views, PDF and ePub downloads, according to the available data) and Abstracts Views on Vision4Press platform.
Data correspond to usage on the plateform after 2015. The current usage metrics is available 48-96 hours after online publication and is updated daily on week days.
Initial download of the metrics may take a while.