Fig. 6
Download original image
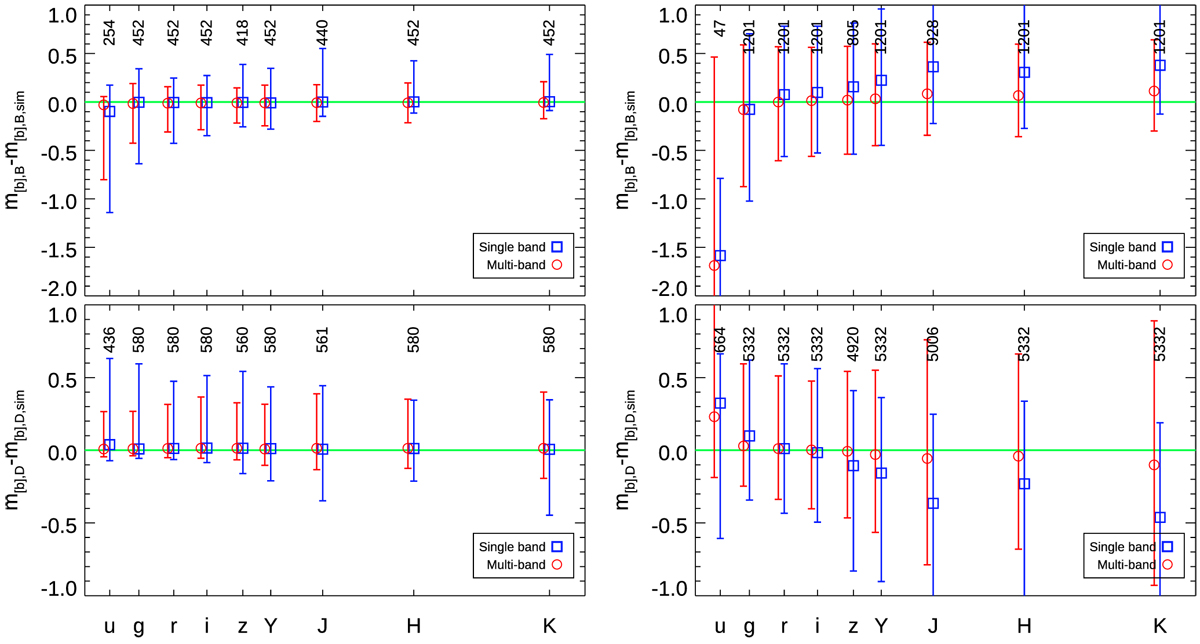
Recovery of magnitude values for bulges (top) and disks (bottom) as a function of wavelength at each band [b], for a bright (mr,B+D,sim < 17.5 mag, left) and faint (18.5 < mr,B+D,sim < 19.5 mag, right) sample for multi-band (red) and single-band (blue) fits. Symbols show median values, and error bars indicate 16 and 84 percentiles. Numbers at the top of the panels indicate the sample size for each data point, for example the 580 bright disk galaxies for which both single-band (in all of griYHK band) and multi-band fitting produce a good fit, and in which the disk is bright enough (mD < mB + 1.5). For uzJ bands, we plot the biggest possible sub-sample of these objects. Deviations towards the top indicate that a component is fit too faintly. We note the different scales on the y axis for bulges and disks.
Current usage metrics show cumulative count of Article Views (full-text article views including HTML views, PDF and ePub downloads, according to the available data) and Abstracts Views on Vision4Press platform.
Data correspond to usage on the plateform after 2015. The current usage metrics is available 48-96 hours after online publication and is updated daily on week days.
Initial download of the metrics may take a while.