Fig. 3
Download original image
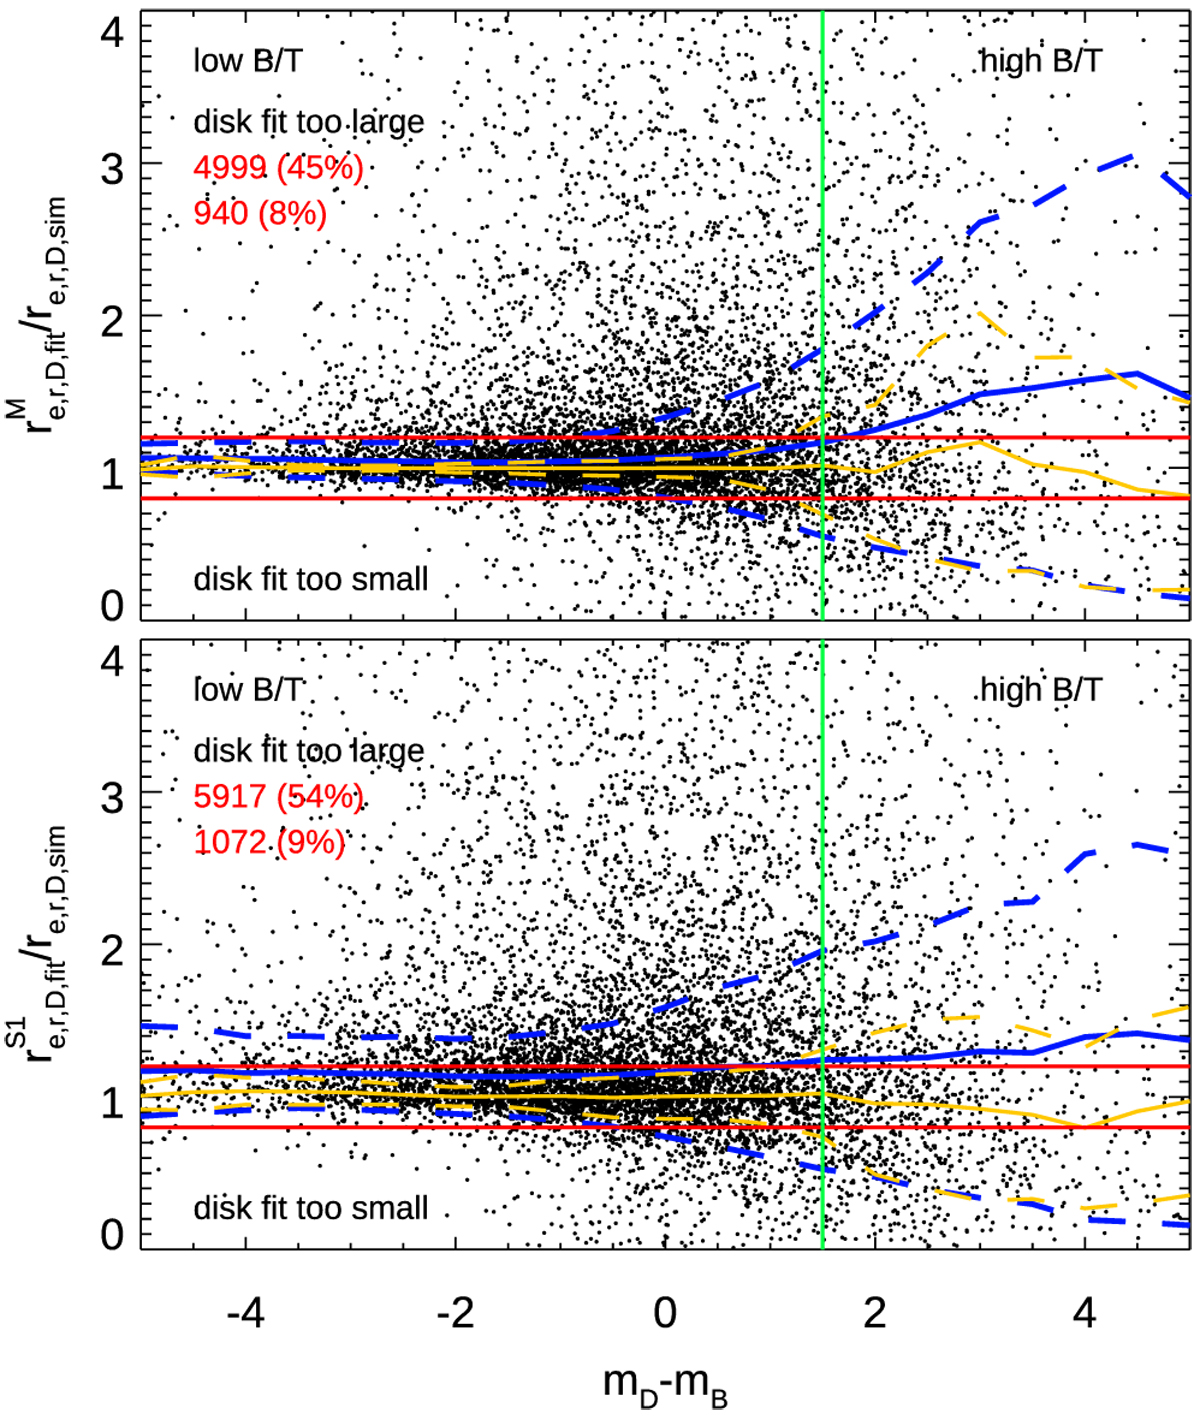
Deviation of fitting to simulated bulge r-band magnitude mr,B,sim − mr,B,fit as a function of the faintness of the bulge for objects with mr < 19.8. Top: multi-band fit, mode M. Bottom: single-band fit, mode S1. The fainter a bulge within a given disk, the harder it is to fit. Red horizontal lines show a (empirically chosen) allowed deviation of ± 0. 5mags. The systematic trend reaches this limit when the bulge is ~1.5 mag fainter than the disk. Red numbers in the top-left corner indicate the numbers and fraction of objects with deviations larger than 0.5 mag above (top number) and below (lower number).
Current usage metrics show cumulative count of Article Views (full-text article views including HTML views, PDF and ePub downloads, according to the available data) and Abstracts Views on Vision4Press platform.
Data correspond to usage on the plateform after 2015. The current usage metrics is available 48-96 hours after online publication and is updated daily on week days.
Initial download of the metrics may take a while.