Fig. D.1
Download original image
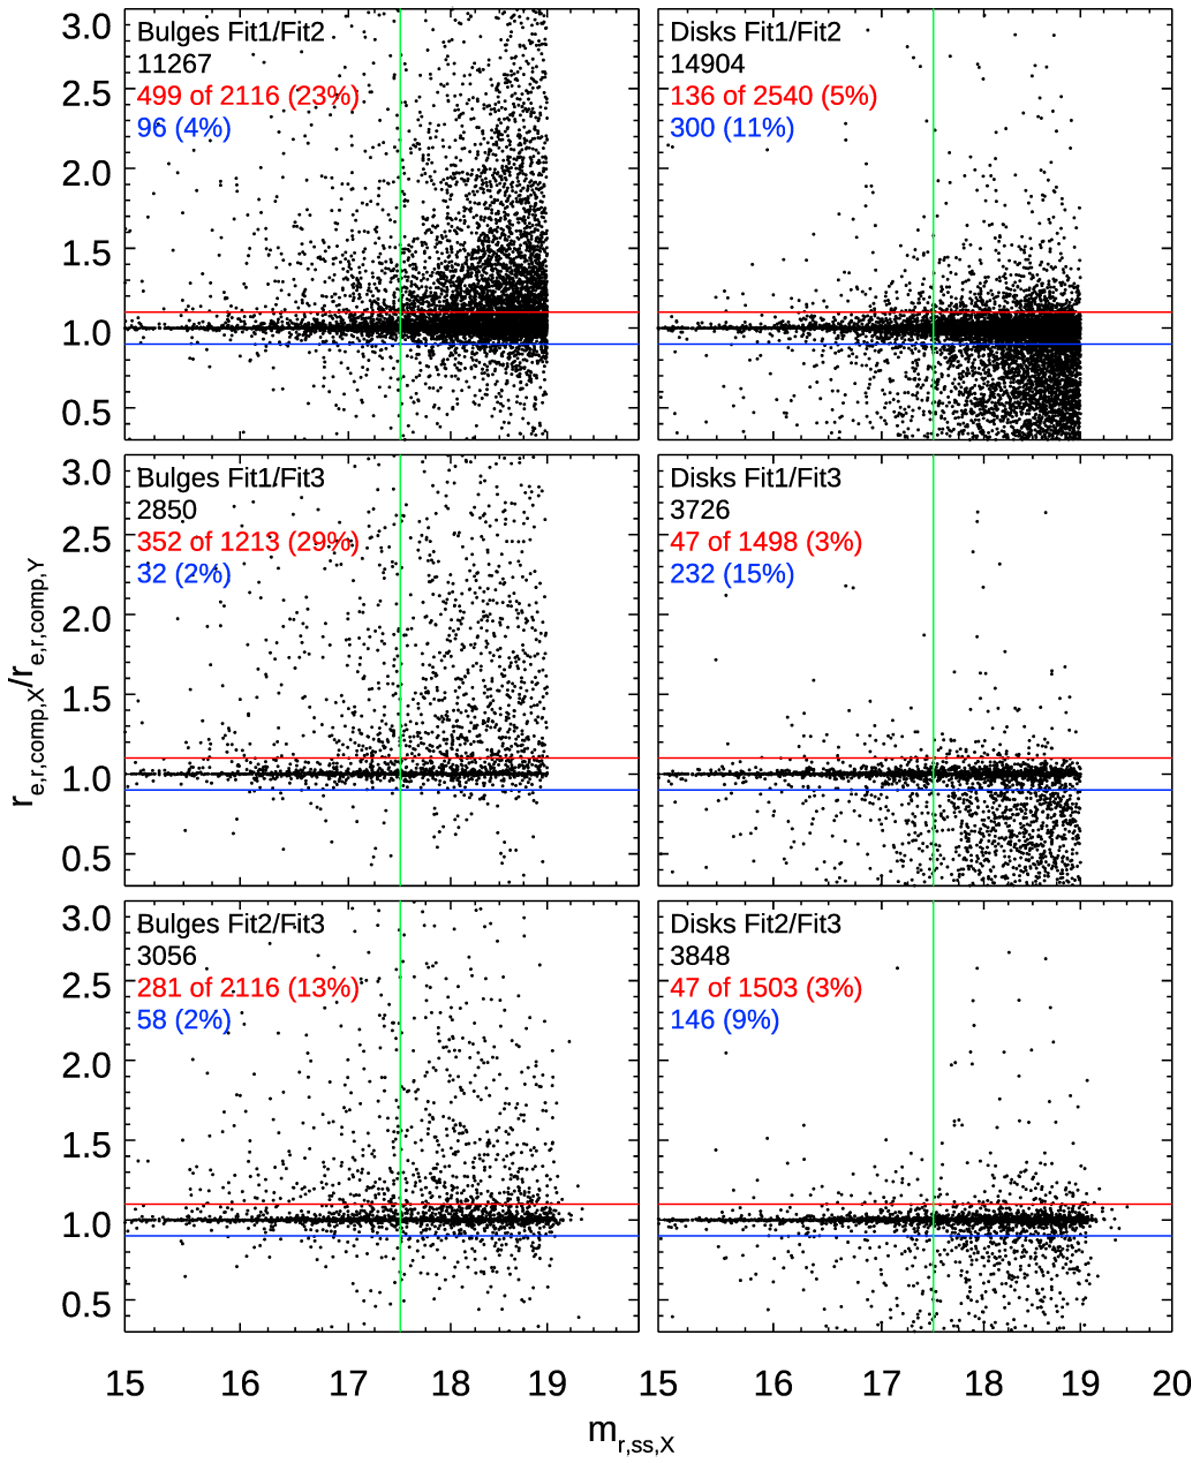
Comparison of fitting parameters using different starting values. The green vertical line indicates a galaxy brightness of mr,SS = 17.5, red and blue horizontal lines indicate 10% deviation from perfect agreement between the fits above and below, respectively. The numbers in red and blue indicate how many galaxies at mr,SS < 17.5 are above and below these 10% limits, respectively. (See text for more details.)
Current usage metrics show cumulative count of Article Views (full-text article views including HTML views, PDF and ePub downloads, according to the available data) and Abstracts Views on Vision4Press platform.
Data correspond to usage on the plateform after 2015. The current usage metrics is available 48-96 hours after online publication and is updated daily on week days.
Initial download of the metrics may take a while.