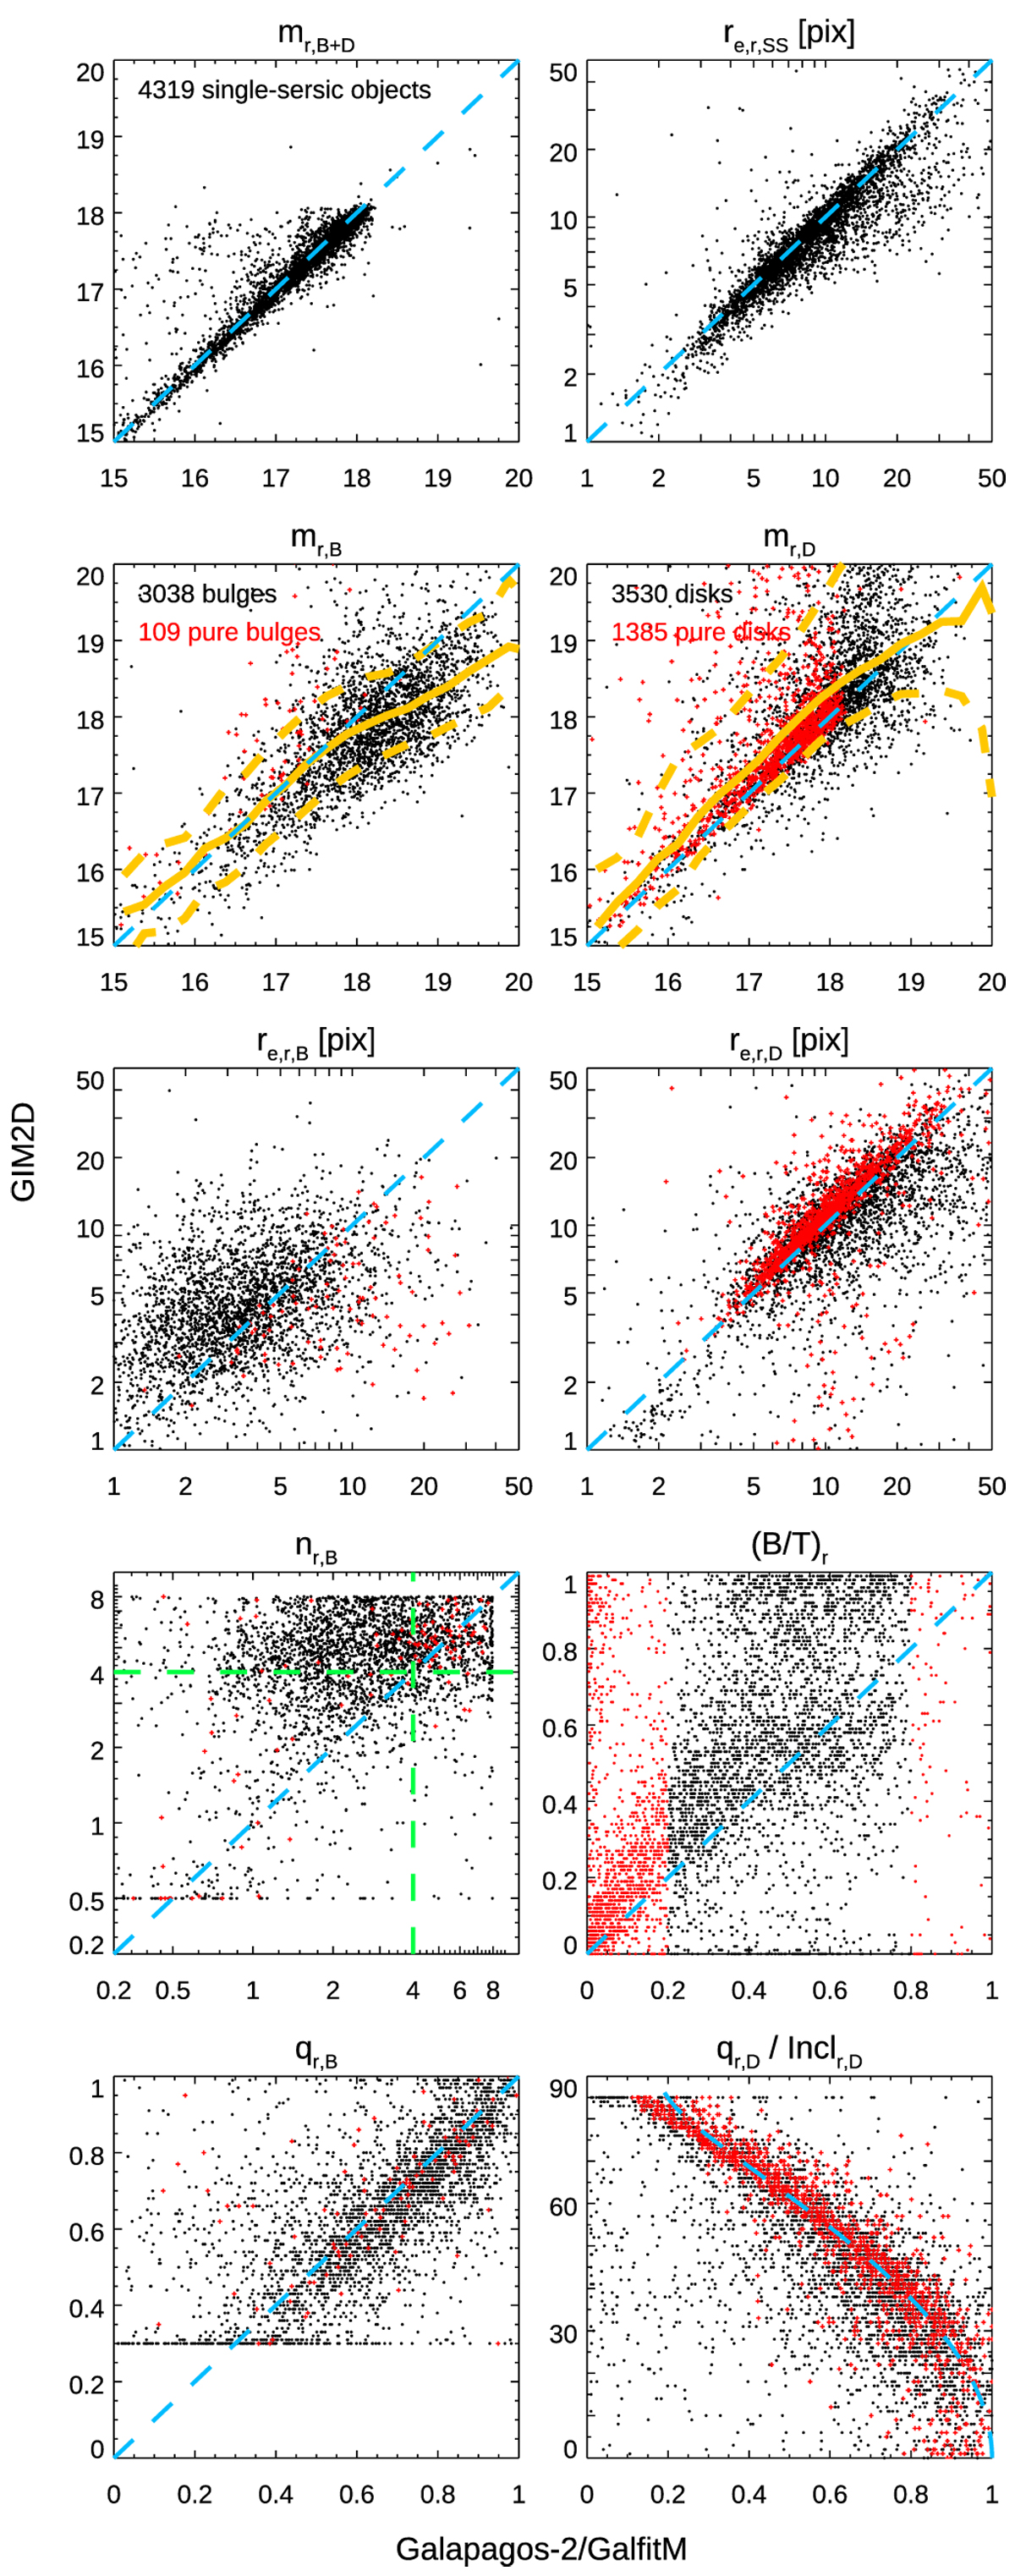
Fig. 26
Download original image
Comparison of fitting parameters with Gim2d from S11. Red points in each panel indicate ‘pure bulges’ and ‘pure disks’, respectively, for which we plot the values from the single-Sérsic fits. A line showing perfect agreement is over-plotted as a dashed light blue line on all panels. (For further details, please see the text.)
Current usage metrics show cumulative count of Article Views (full-text article views including HTML views, PDF and ePub downloads, according to the available data) and Abstracts Views on Vision4Press platform.
Data correspond to usage on the plateform after 2015. The current usage metrics is available 48-96 hours after online publication and is updated daily on week days.
Initial download of the metrics may take a while.