Fig. 24
Download original image
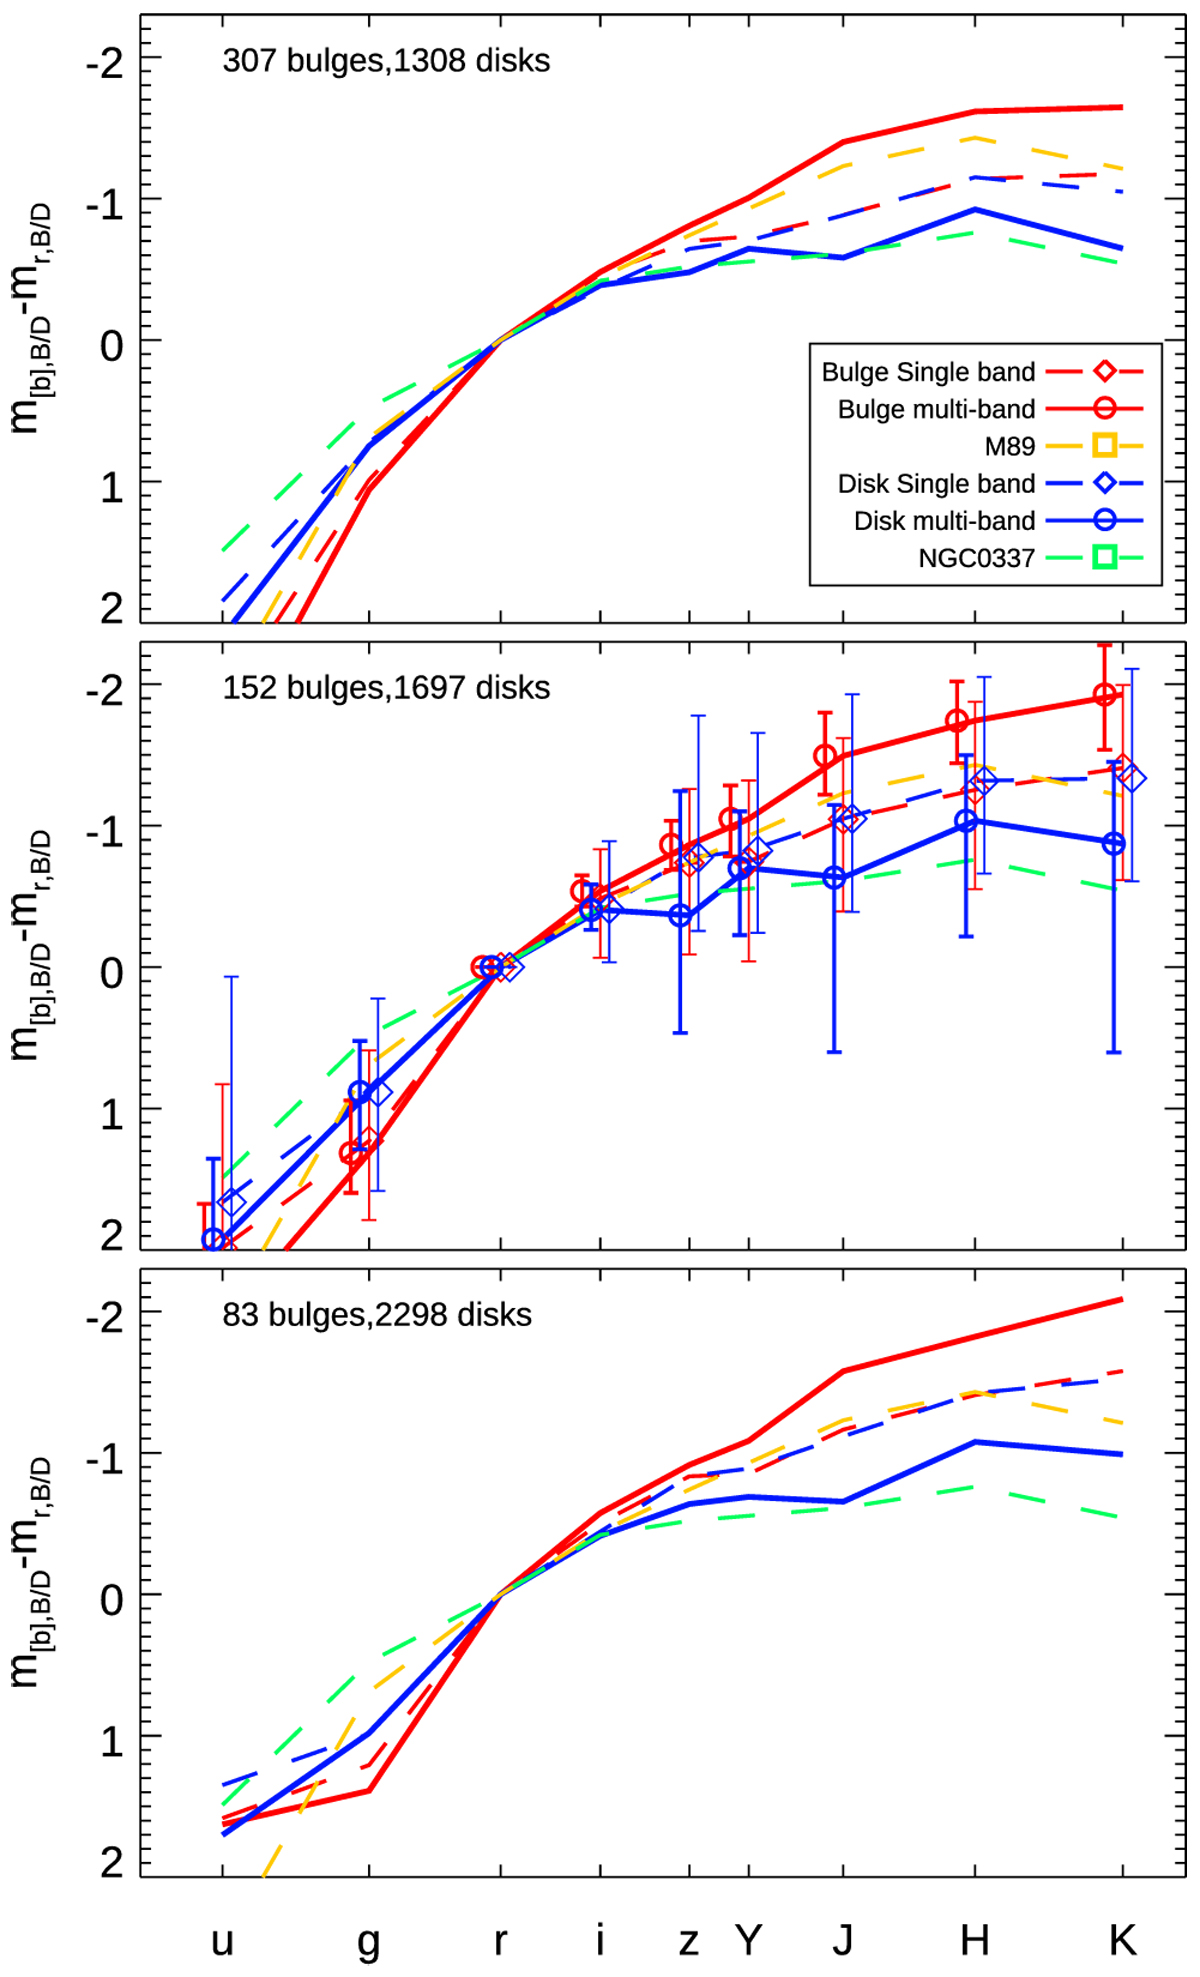
Average SEDs of bulges and disks in real galaxies for the largest possible sample, i.e. all single-band and multi-band fits (excluding u-and z-band fits) that produced good fit results. The SEDs recovered using single-band fitting are shown as blue and red dashed lines, respectively, and the values recovered from multi-band fitting are shown as solid lines. Error bars in the middle panel indicate the scatter of the distributions. Bold error bars (offset to the left) are given for multi-band fits for bulge (red) and disks (blue), and thin lines (offset to the right) for single-band fits. The brightest galaxies at mr < 17.5 (harbouring 307 bulges and 1308 disks) are shown in the top panel, 17.5 < mr < 18.5 in the middle panel, and 18.5 < mr < 19.5 in the bottom panel. For comparison, the dashed orange line shows the SED of a typical quiescent galaxy (M 89), and the dashed green line shows the SED of a typical star-forming, bulge-less galaxy (NGC 0337).
Current usage metrics show cumulative count of Article Views (full-text article views including HTML views, PDF and ePub downloads, according to the available data) and Abstracts Views on Vision4Press platform.
Data correspond to usage on the plateform after 2015. The current usage metrics is available 48-96 hours after online publication and is updated daily on week days.
Initial download of the metrics may take a while.