Free Access
Fig. 23
Download original image
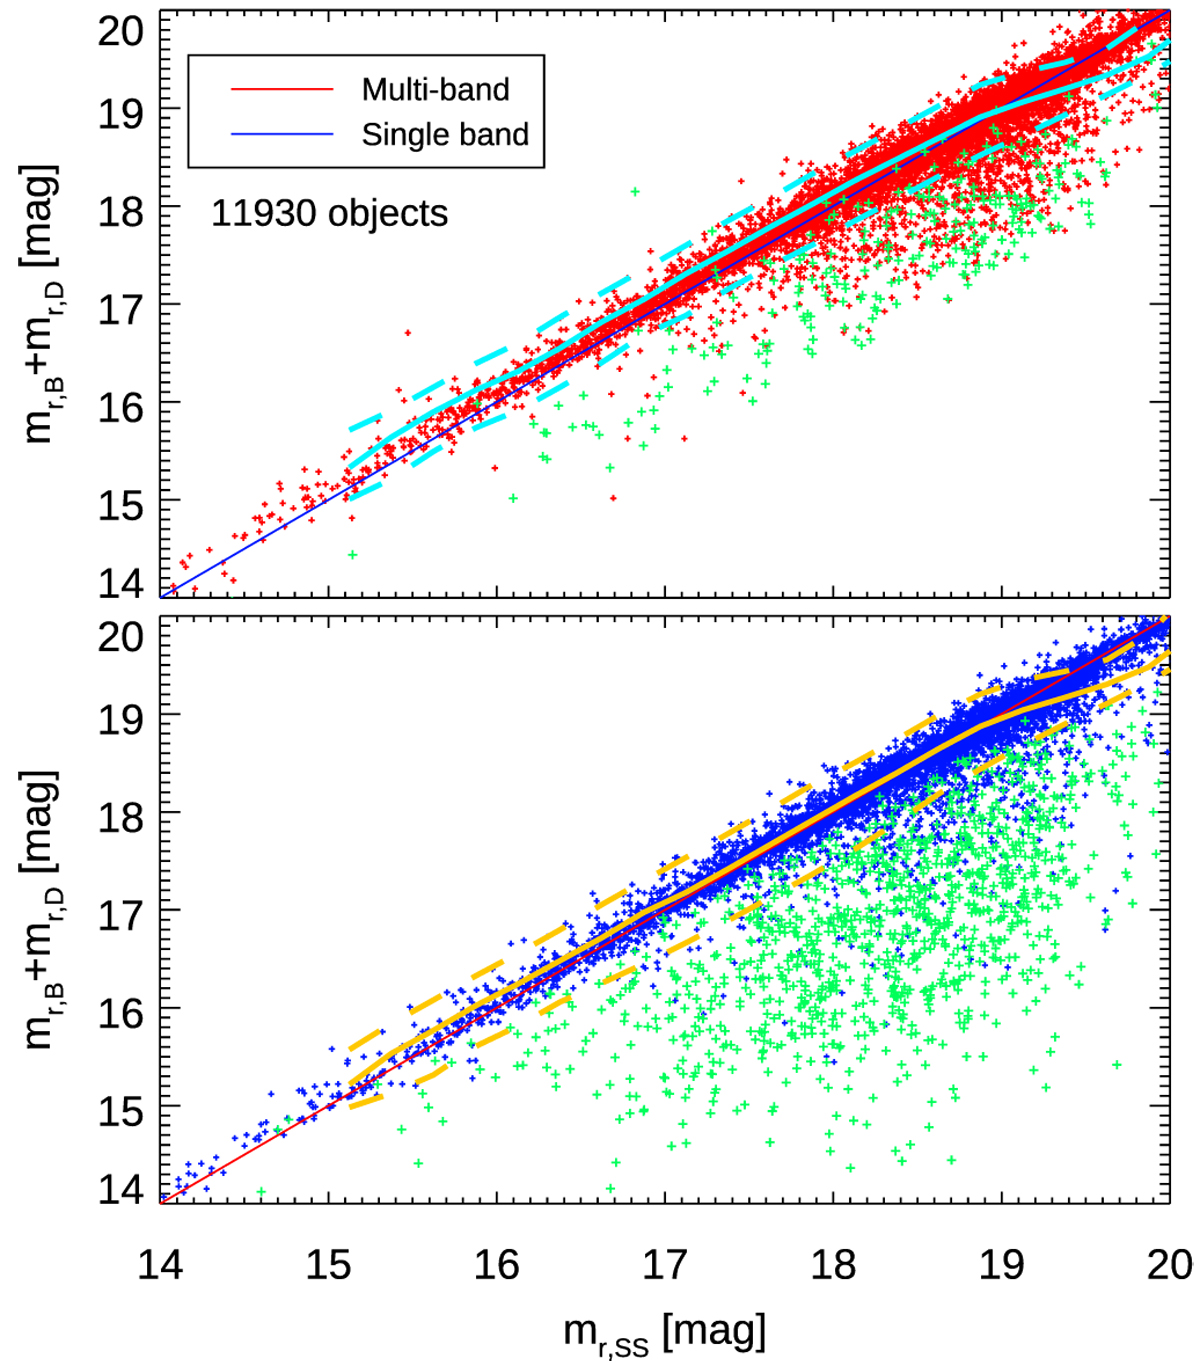
Gama: Comparison of total (bulge plus disk) magnitude and single-Sérsic magnitude in both multi-band (top) and single-band (bottom) fitting. Lines represent the rolling median and 16/84 percentiles. points in green highlight objects where one of the components is fit with re > 200 [pix].
Current usage metrics show cumulative count of Article Views (full-text article views including HTML views, PDF and ePub downloads, according to the available data) and Abstracts Views on Vision4Press platform.
Data correspond to usage on the plateform after 2015. The current usage metrics is available 48-96 hours after online publication and is updated daily on week days.
Initial download of the metrics may take a while.