Fig. 22
Download original image
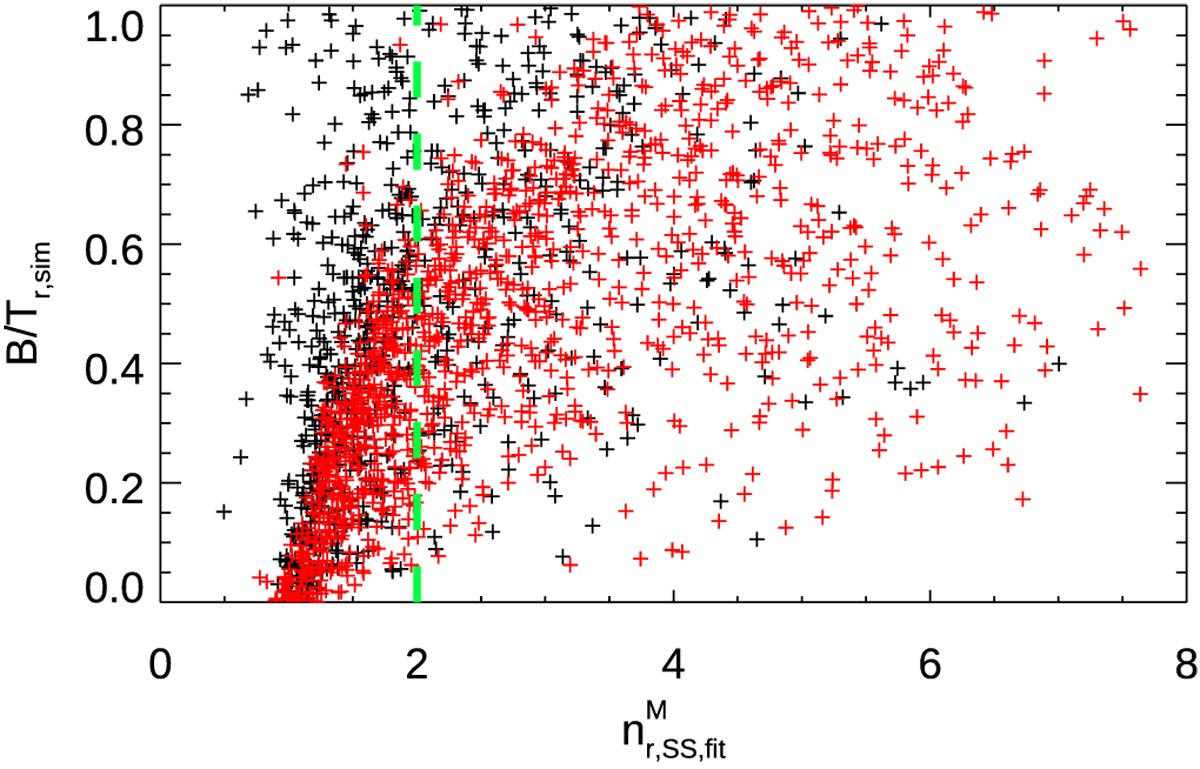
Comparison of the B/Tr,sim values of the simulated galaxies against the Sérsic indices, nss, derived from single-Sérsic fits, for galaxies with mr < 18.5, using multi-band fits. Red and black points represent galaxies with nB,sim > 3.5 and nB,sim < 3.5, respectively. The vertical green line indicates nss = 2, which is often used in the literature to separate disk- from bulge-dominated galaxies. Only a weak correlation between the single-Sérsic value, nss, and the B/T flux ratio is visible, with very wide scatter.
Current usage metrics show cumulative count of Article Views (full-text article views including HTML views, PDF and ePub downloads, according to the available data) and Abstracts Views on Vision4Press platform.
Data correspond to usage on the plateform after 2015. The current usage metrics is available 48-96 hours after online publication and is updated daily on week days.
Initial download of the metrics may take a while.