Fig. 21
Download original image
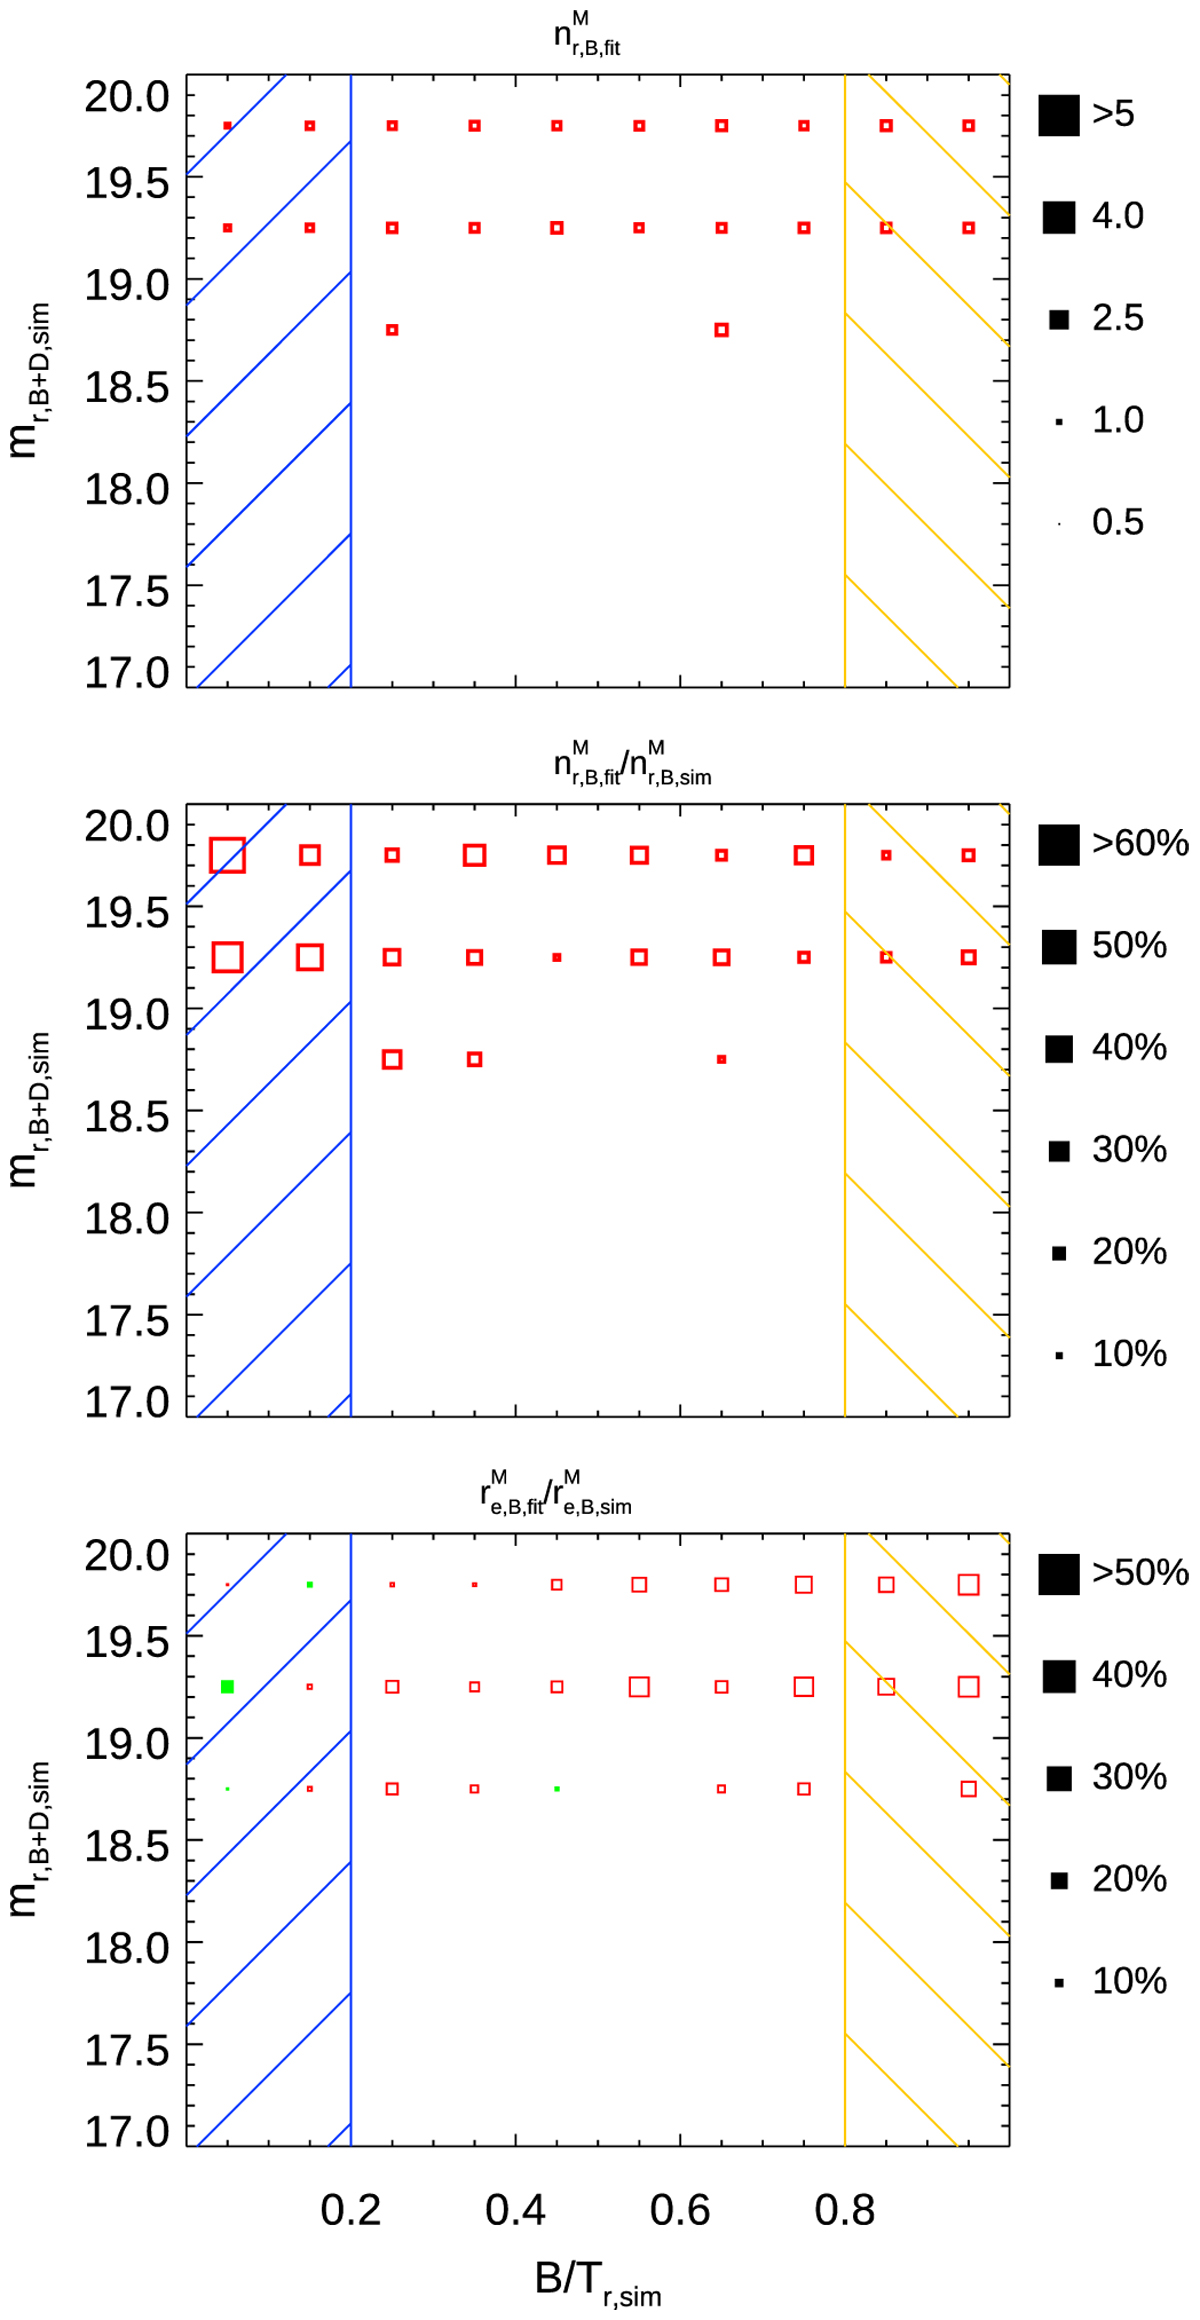
Recovery of pseudo bulges: Average nB,fit of galaxies with 1 < nB,sim < 2 (top panel, ideal fits would show uniform values of ~1.5 throughout this panel), comparison with simulated values nB,fit/nB,sim (middle panel), and size comparison reB,fit/reB,sim (bottom panel) for the same sample. Symbol sizes in the lower two panels indicate the deviation from an ideal value, i.e. 1; ideal fits are hence indicated by small symbols. Only bins with more than 20 objects are shown, to ensure reasonable number statistics in each bin.
Current usage metrics show cumulative count of Article Views (full-text article views including HTML views, PDF and ePub downloads, according to the available data) and Abstracts Views on Vision4Press platform.
Data correspond to usage on the plateform after 2015. The current usage metrics is available 48-96 hours after online publication and is updated daily on week days.
Initial download of the metrics may take a while.