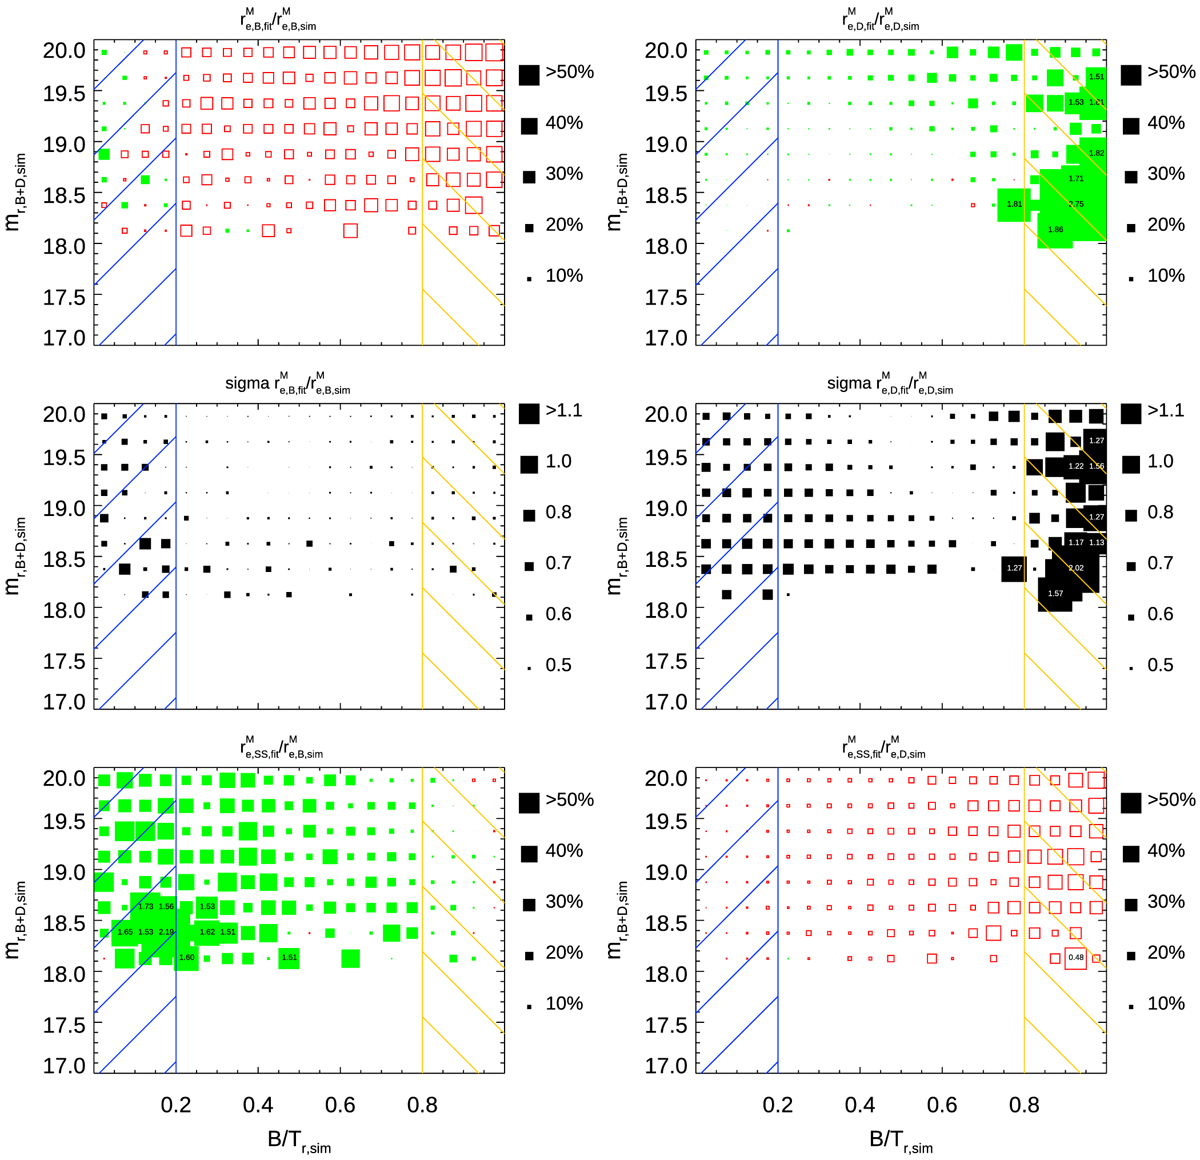
Fig. 15
Download original image
Recovery, offset and scatter, of component sizes in multi-band fits as a function of B/T and input magnitude mr,B+D,Sim. Top left: bulge sizes, rr,B,fit, from B/D fits. Symbol sizes indicate the deviation from an ideal value, i.e. 1 (ideal fits produce small symbols). Middle: standard deviation of the same value (small symbols represent good fits and small scatter). Bottom left: comparison of single-Sérsic sizes, rr,ss,flt, to the simulated size, rr,B,Sim. Where these values agree, the symbols should be small. At (B/T)sim > 0.8, single-Sérsic fits fit the bulge sizes well. Right column: same plots, but for disk sizes. At (B/T)sim < 0.2, the single-Sérsic size agrees well with the simulated disk size. As bulge and disk sizes are measured constant with wavelength, this figure looks identical in all bands. Only bins with more than 20 objects are shown, to ensure reasonable number statistics in each bin.
Current usage metrics show cumulative count of Article Views (full-text article views including HTML views, PDF and ePub downloads, according to the available data) and Abstracts Views on Vision4Press platform.
Data correspond to usage on the plateform after 2015. The current usage metrics is available 48-96 hours after online publication and is updated daily on week days.
Initial download of the metrics may take a while.