Fig. 13
Download original image
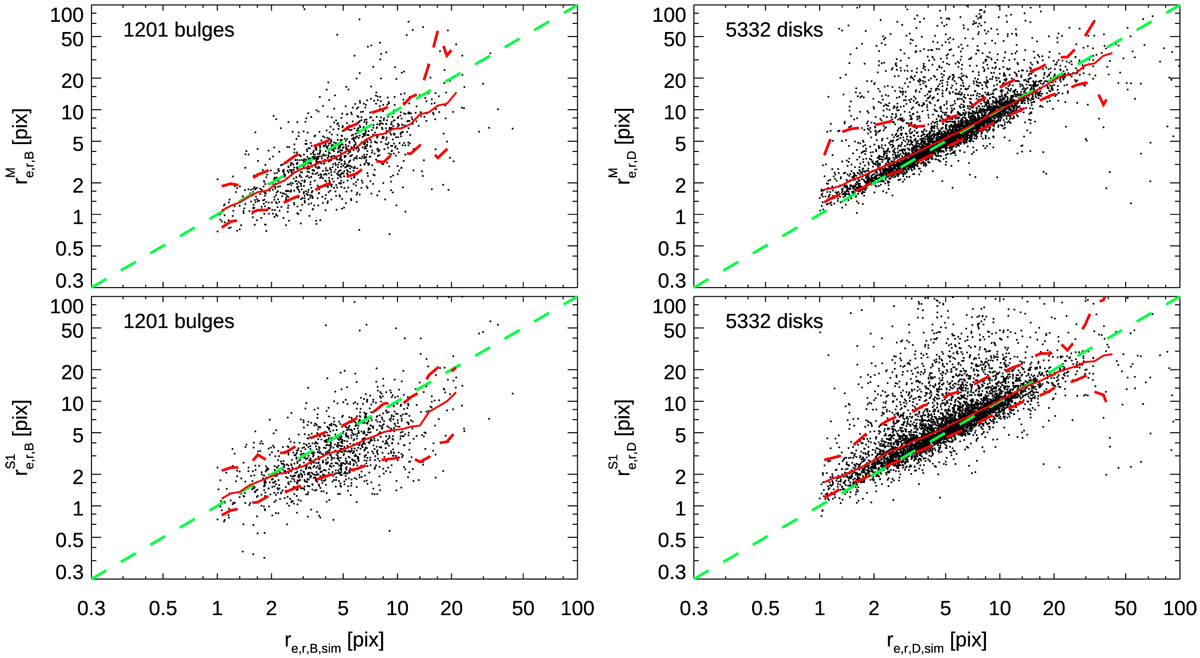
Recovery of disk and bulge sizes. Left column: comparison of input (x axis) and output (y axis) bulge size re,B values for galaxies at mr,B+D,Sim < 19.5 mag from multi-band fits (top) and single-band fits (bottom). All measurements are given in pixels. Red lines indicate the rolling median and the scatter along the distribution. Right column: same plots, but for disk sizes.
Current usage metrics show cumulative count of Article Views (full-text article views including HTML views, PDF and ePub downloads, according to the available data) and Abstracts Views on Vision4Press platform.
Data correspond to usage on the plateform after 2015. The current usage metrics is available 48-96 hours after online publication and is updated daily on week days.
Initial download of the metrics may take a while.